2 The Heart
Circulation
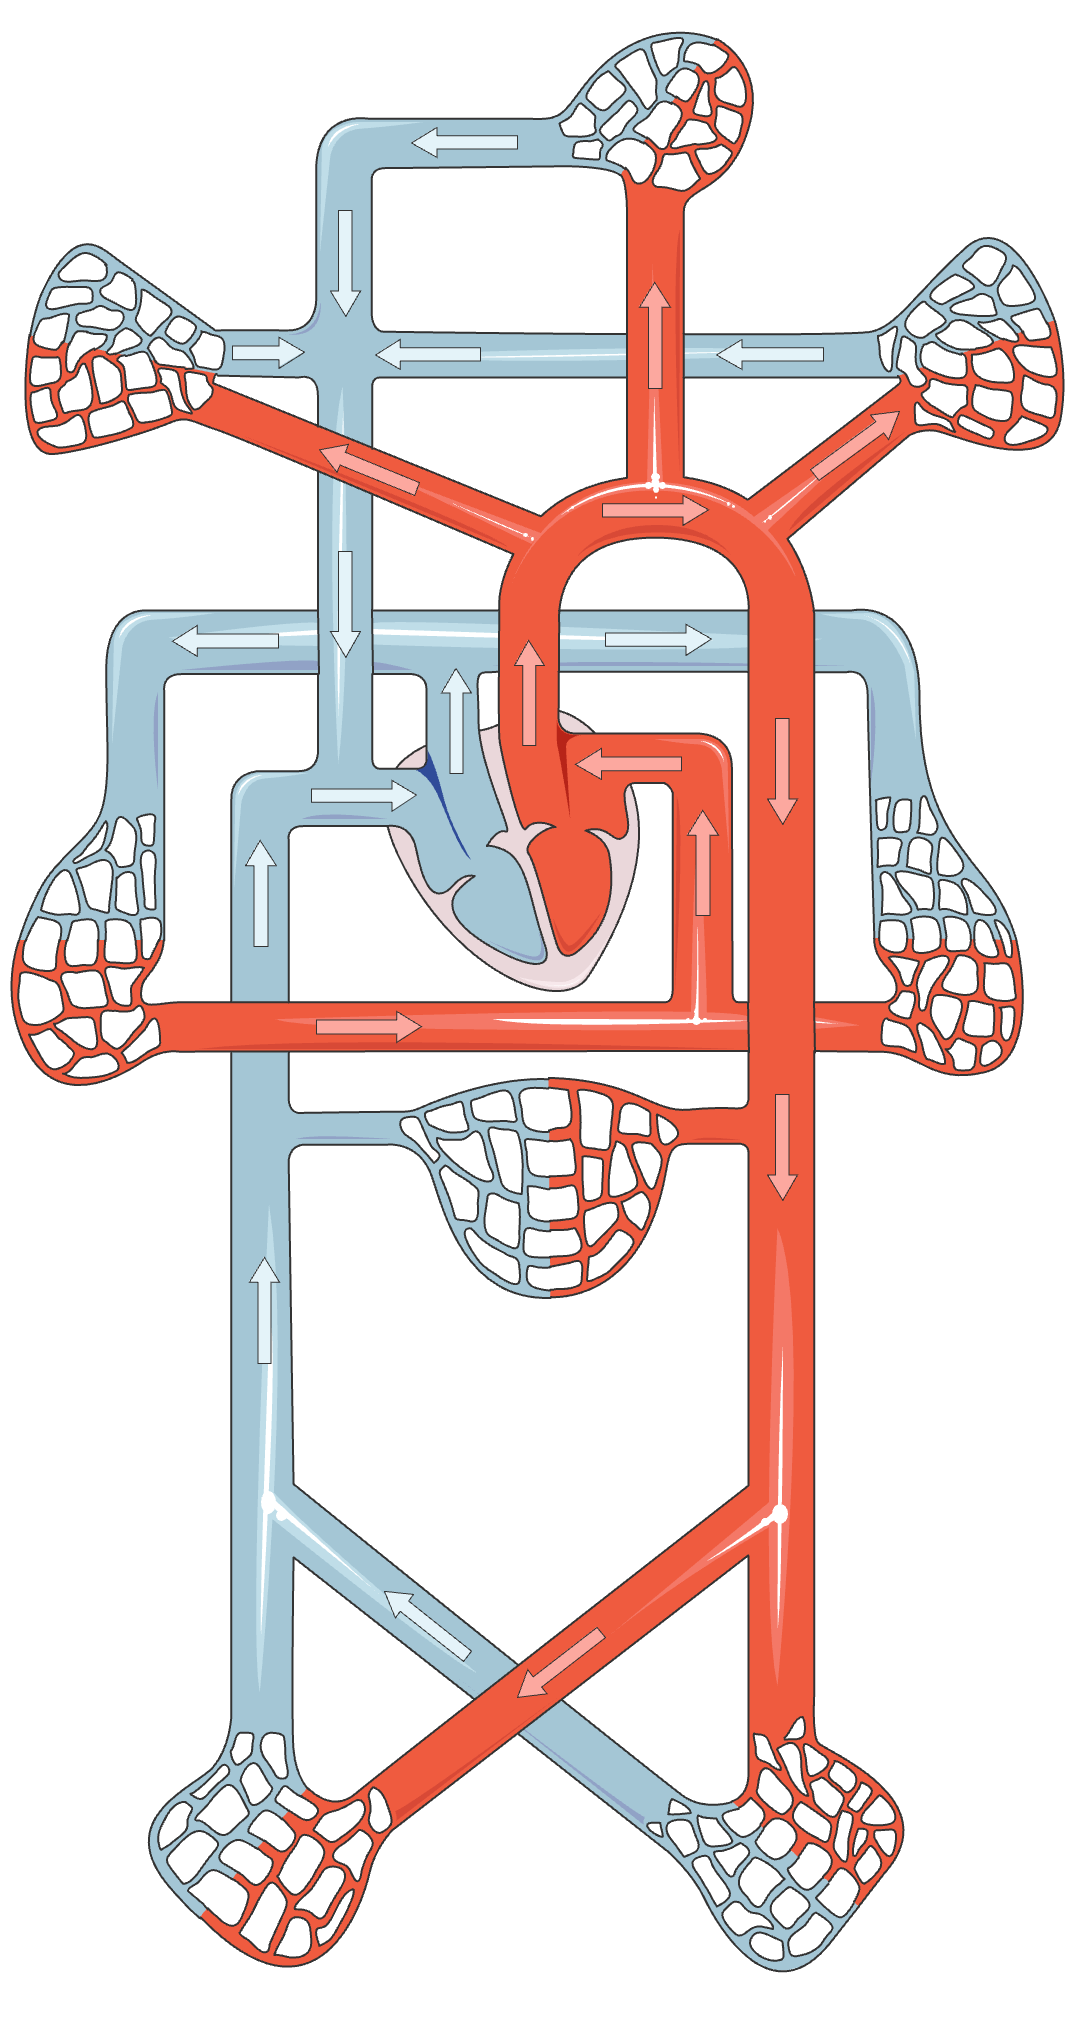
The circulation system is the body’s transport network. The heart drives blood through two linked loops: the pulmonary circuit sends blood to the lungs for gas exchange, and the systemic circuit delivers oxygen and nutrients to tissues while returning waste products for removal.
Anatomy of the heart
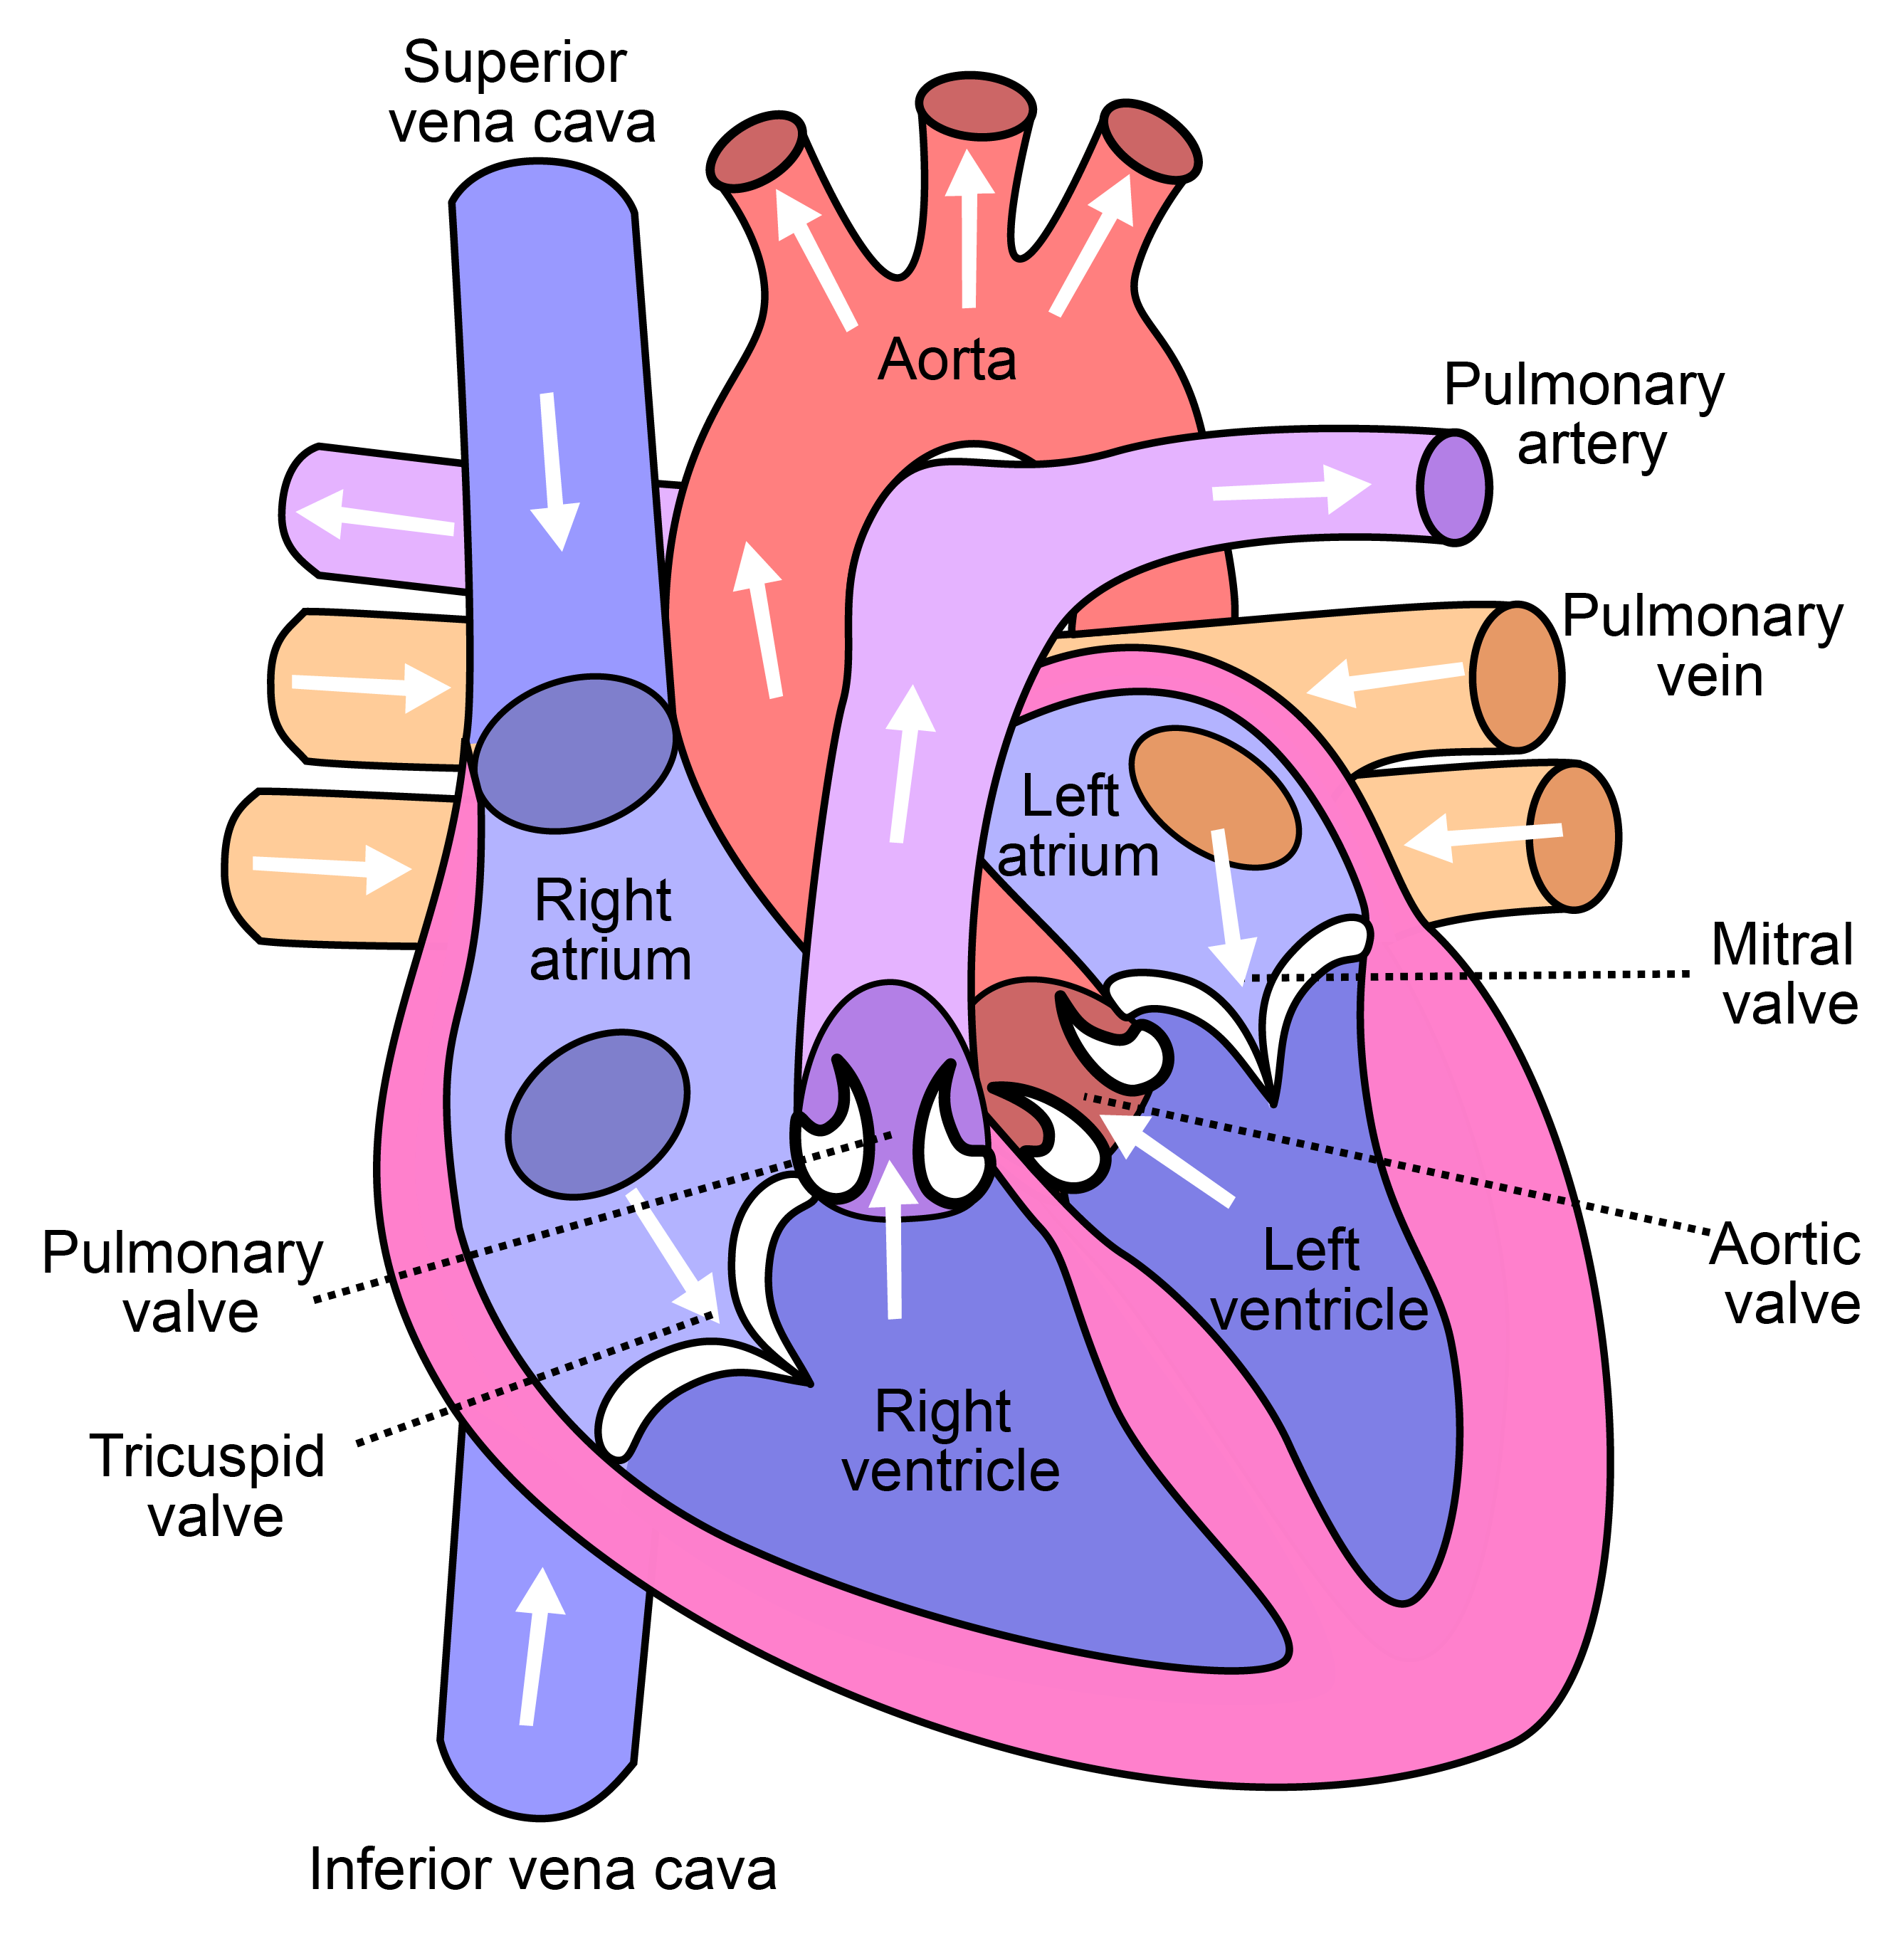
Each side of the heart comprises two chambers, one above the other. The upper chamber, the atrium, is a thin-walled reservoir that collects incoming blood and completes the filling of the chamber below it. The lower chamber, the ventricle, has thick muscular walls and performs the pumping. Blood therefore flows in the fixed sequence atrium → ventricle → out: into the right atrium, down to the right ventricle, out to the lungs; and into the left atrium, down to the left ventricle, out to the body.
To build pressure, a pump must prevent its fluid from returning backward as the chamber contracts. This is the function of the four valves, which act as one-way check valves: flaps opened by forward flow and closed by any reverse pressure. Between each atrium and ventricle lies an atrioventricular (AV) valve (the mitral valve on the left, the tricuspid on the right). At the outlet of each ventricle lies a semilunar valve (the aortic valve on the left, the pulmonary on the right). When a ventricle contracts, its AV valve closes, preventing backflow into the atrium, while its semilunar valve opens to permit ejection. When the ventricle relaxes, the semilunar valve closes to prevent return, and the AV valve reopens to admit the next filling. Figure 2.2 shows these labeled chambers, vessels, and valves.
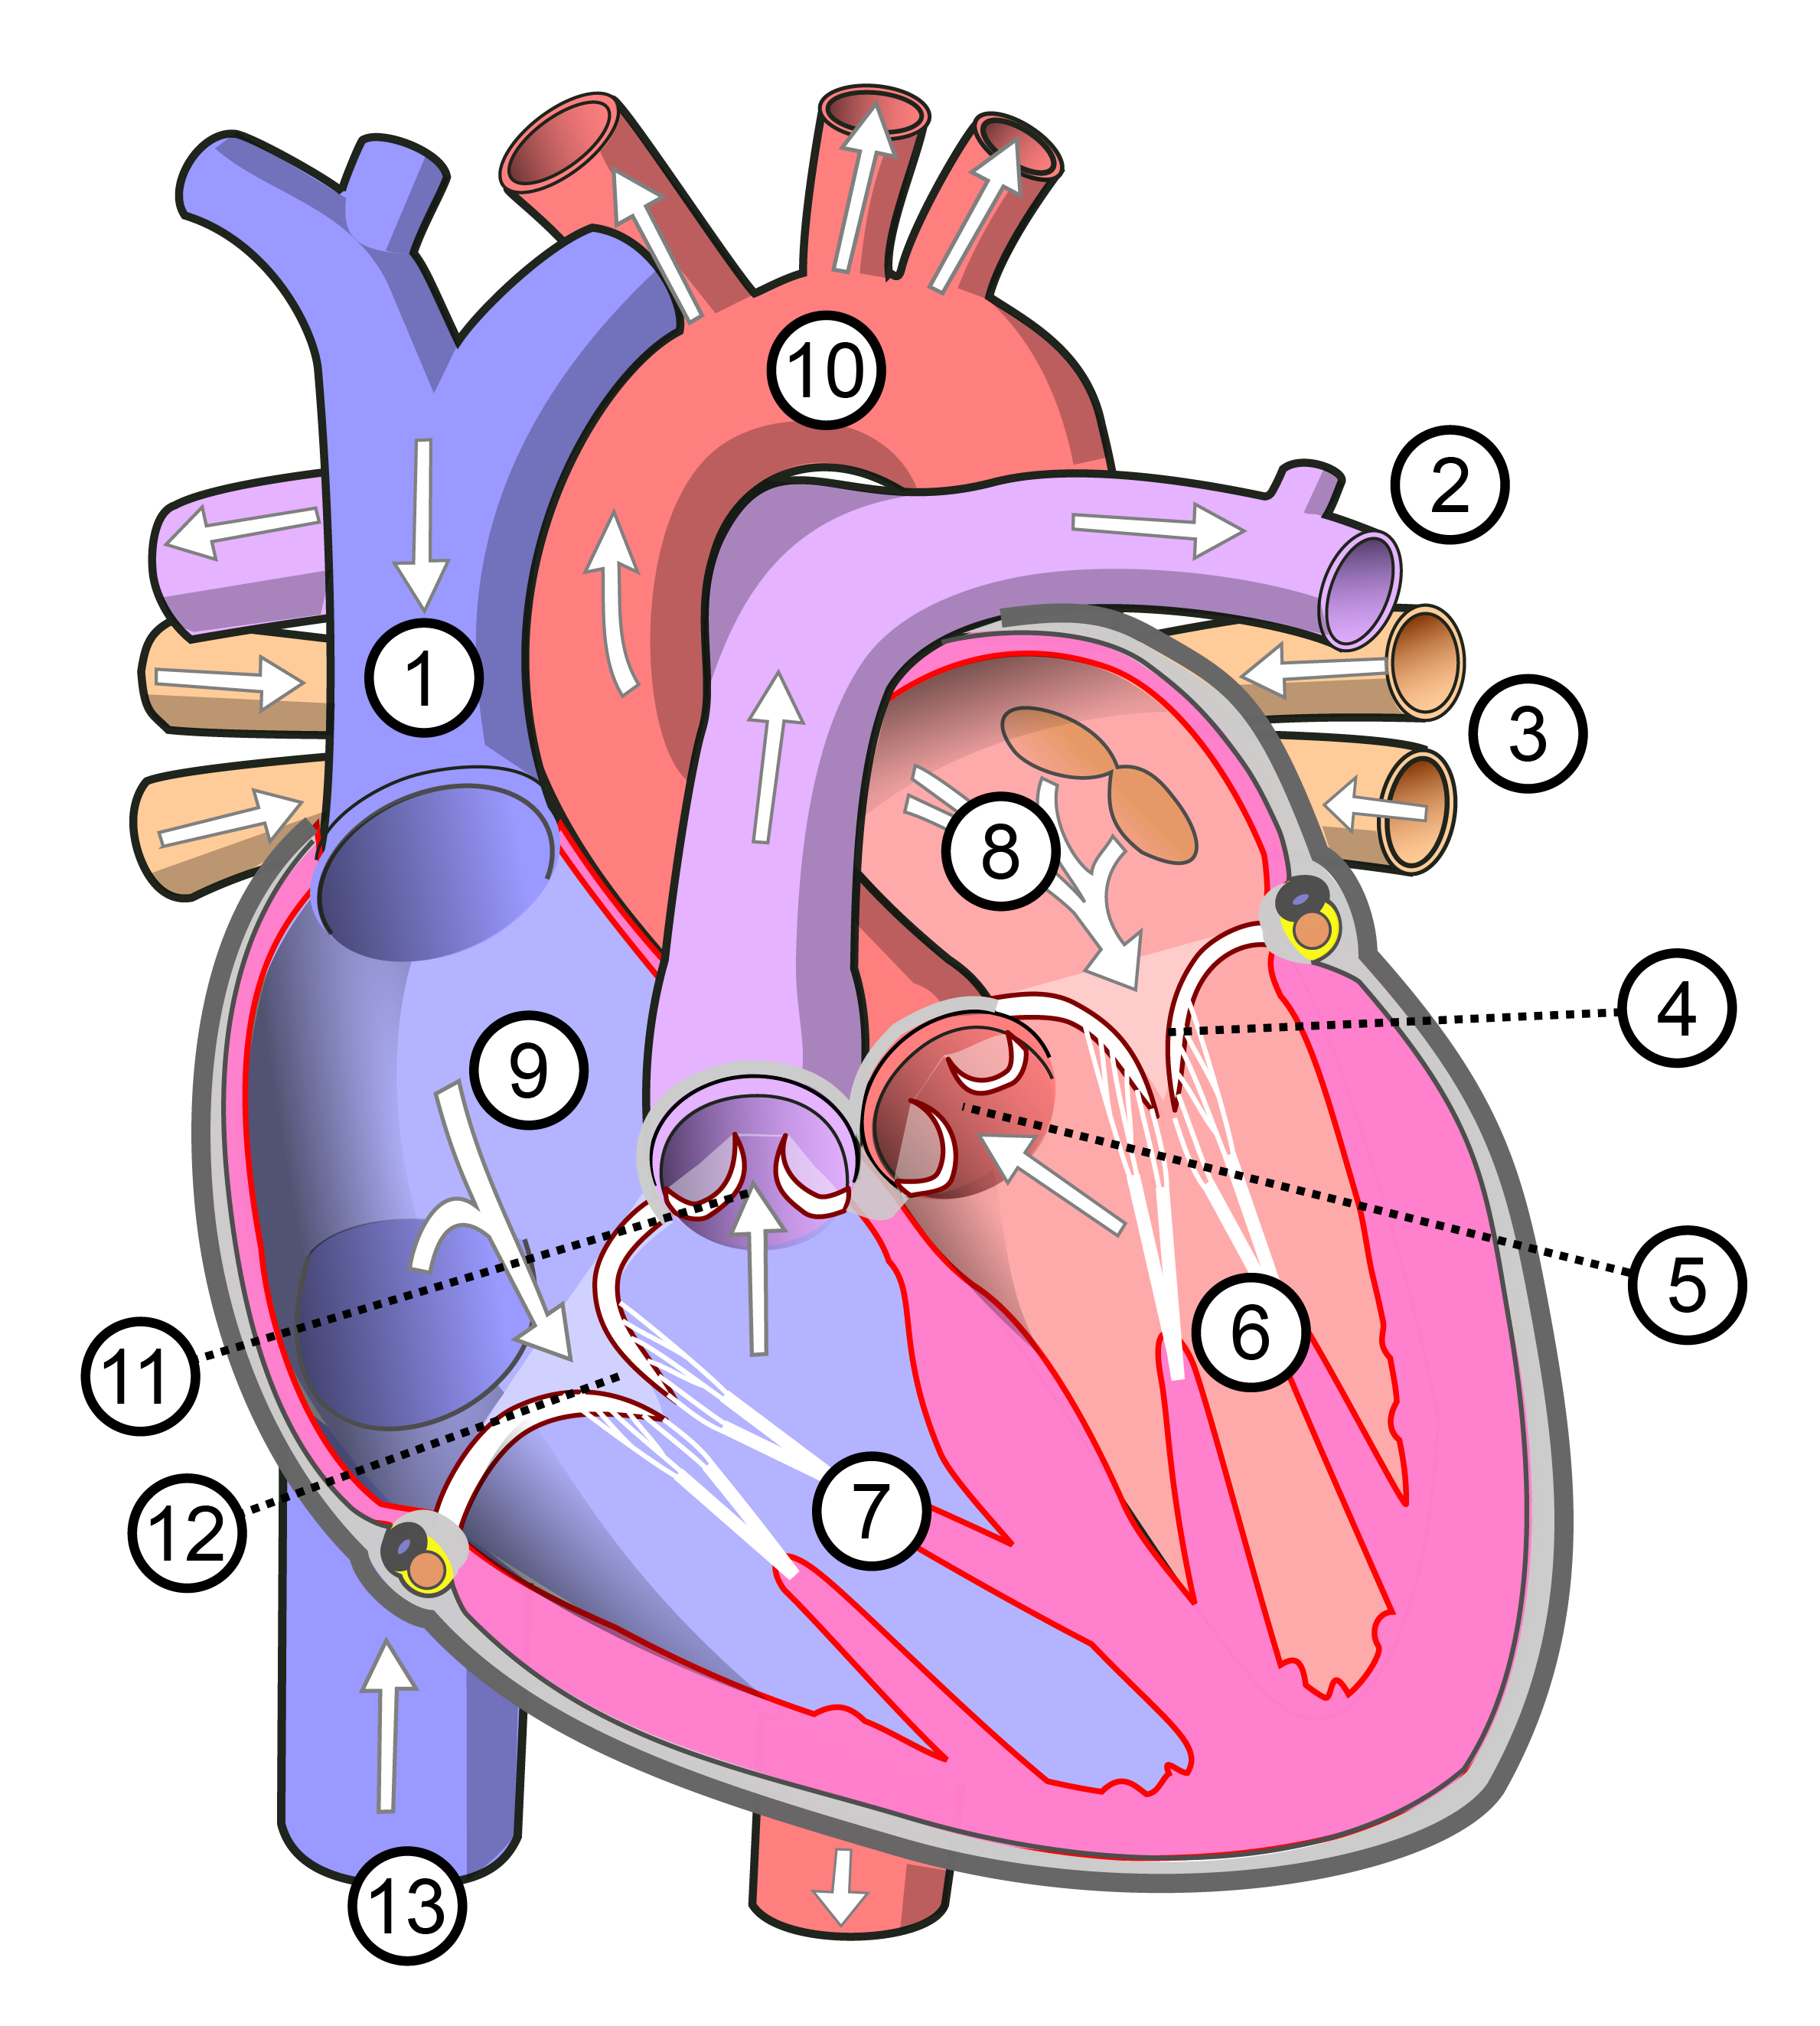
Label the four chambers and four valves on the unlabeled heart in Figure 2.3.
The heart is a pump
The heart is a pump. It generates pressure by contracting a chamber. As the pressure builds, a valve opens, and the pressure difference causes fluid (blood) to flow. A fluid flows down a pressure gradient, from high pressure to low. The heart therefore must generate pressure high enough at the start of the circuit for the blood to traverse the entire body and return.
The heart is in fact two pumps operating side by side. The right heart receives oxygen-poor blood returning from the body and drives it a short distance to the lungs, where it takes up oxygen; this is the pulmonary circuit. The left heart receives the newly oxygenated blood and drives it to the remainder of the body, the systemic circuit. The systemic circuit is far longer and offers greater resistance, so the left heart operates at substantially higher pressure than the right.
Core concept — Pressure
The cardiac pressure cycle
We can trace the pressure in the left ventricle over a single heart beat (Figure 2.4). The right heart executes a nearly identical sequence simultaneously, at proportionally lower pressures.
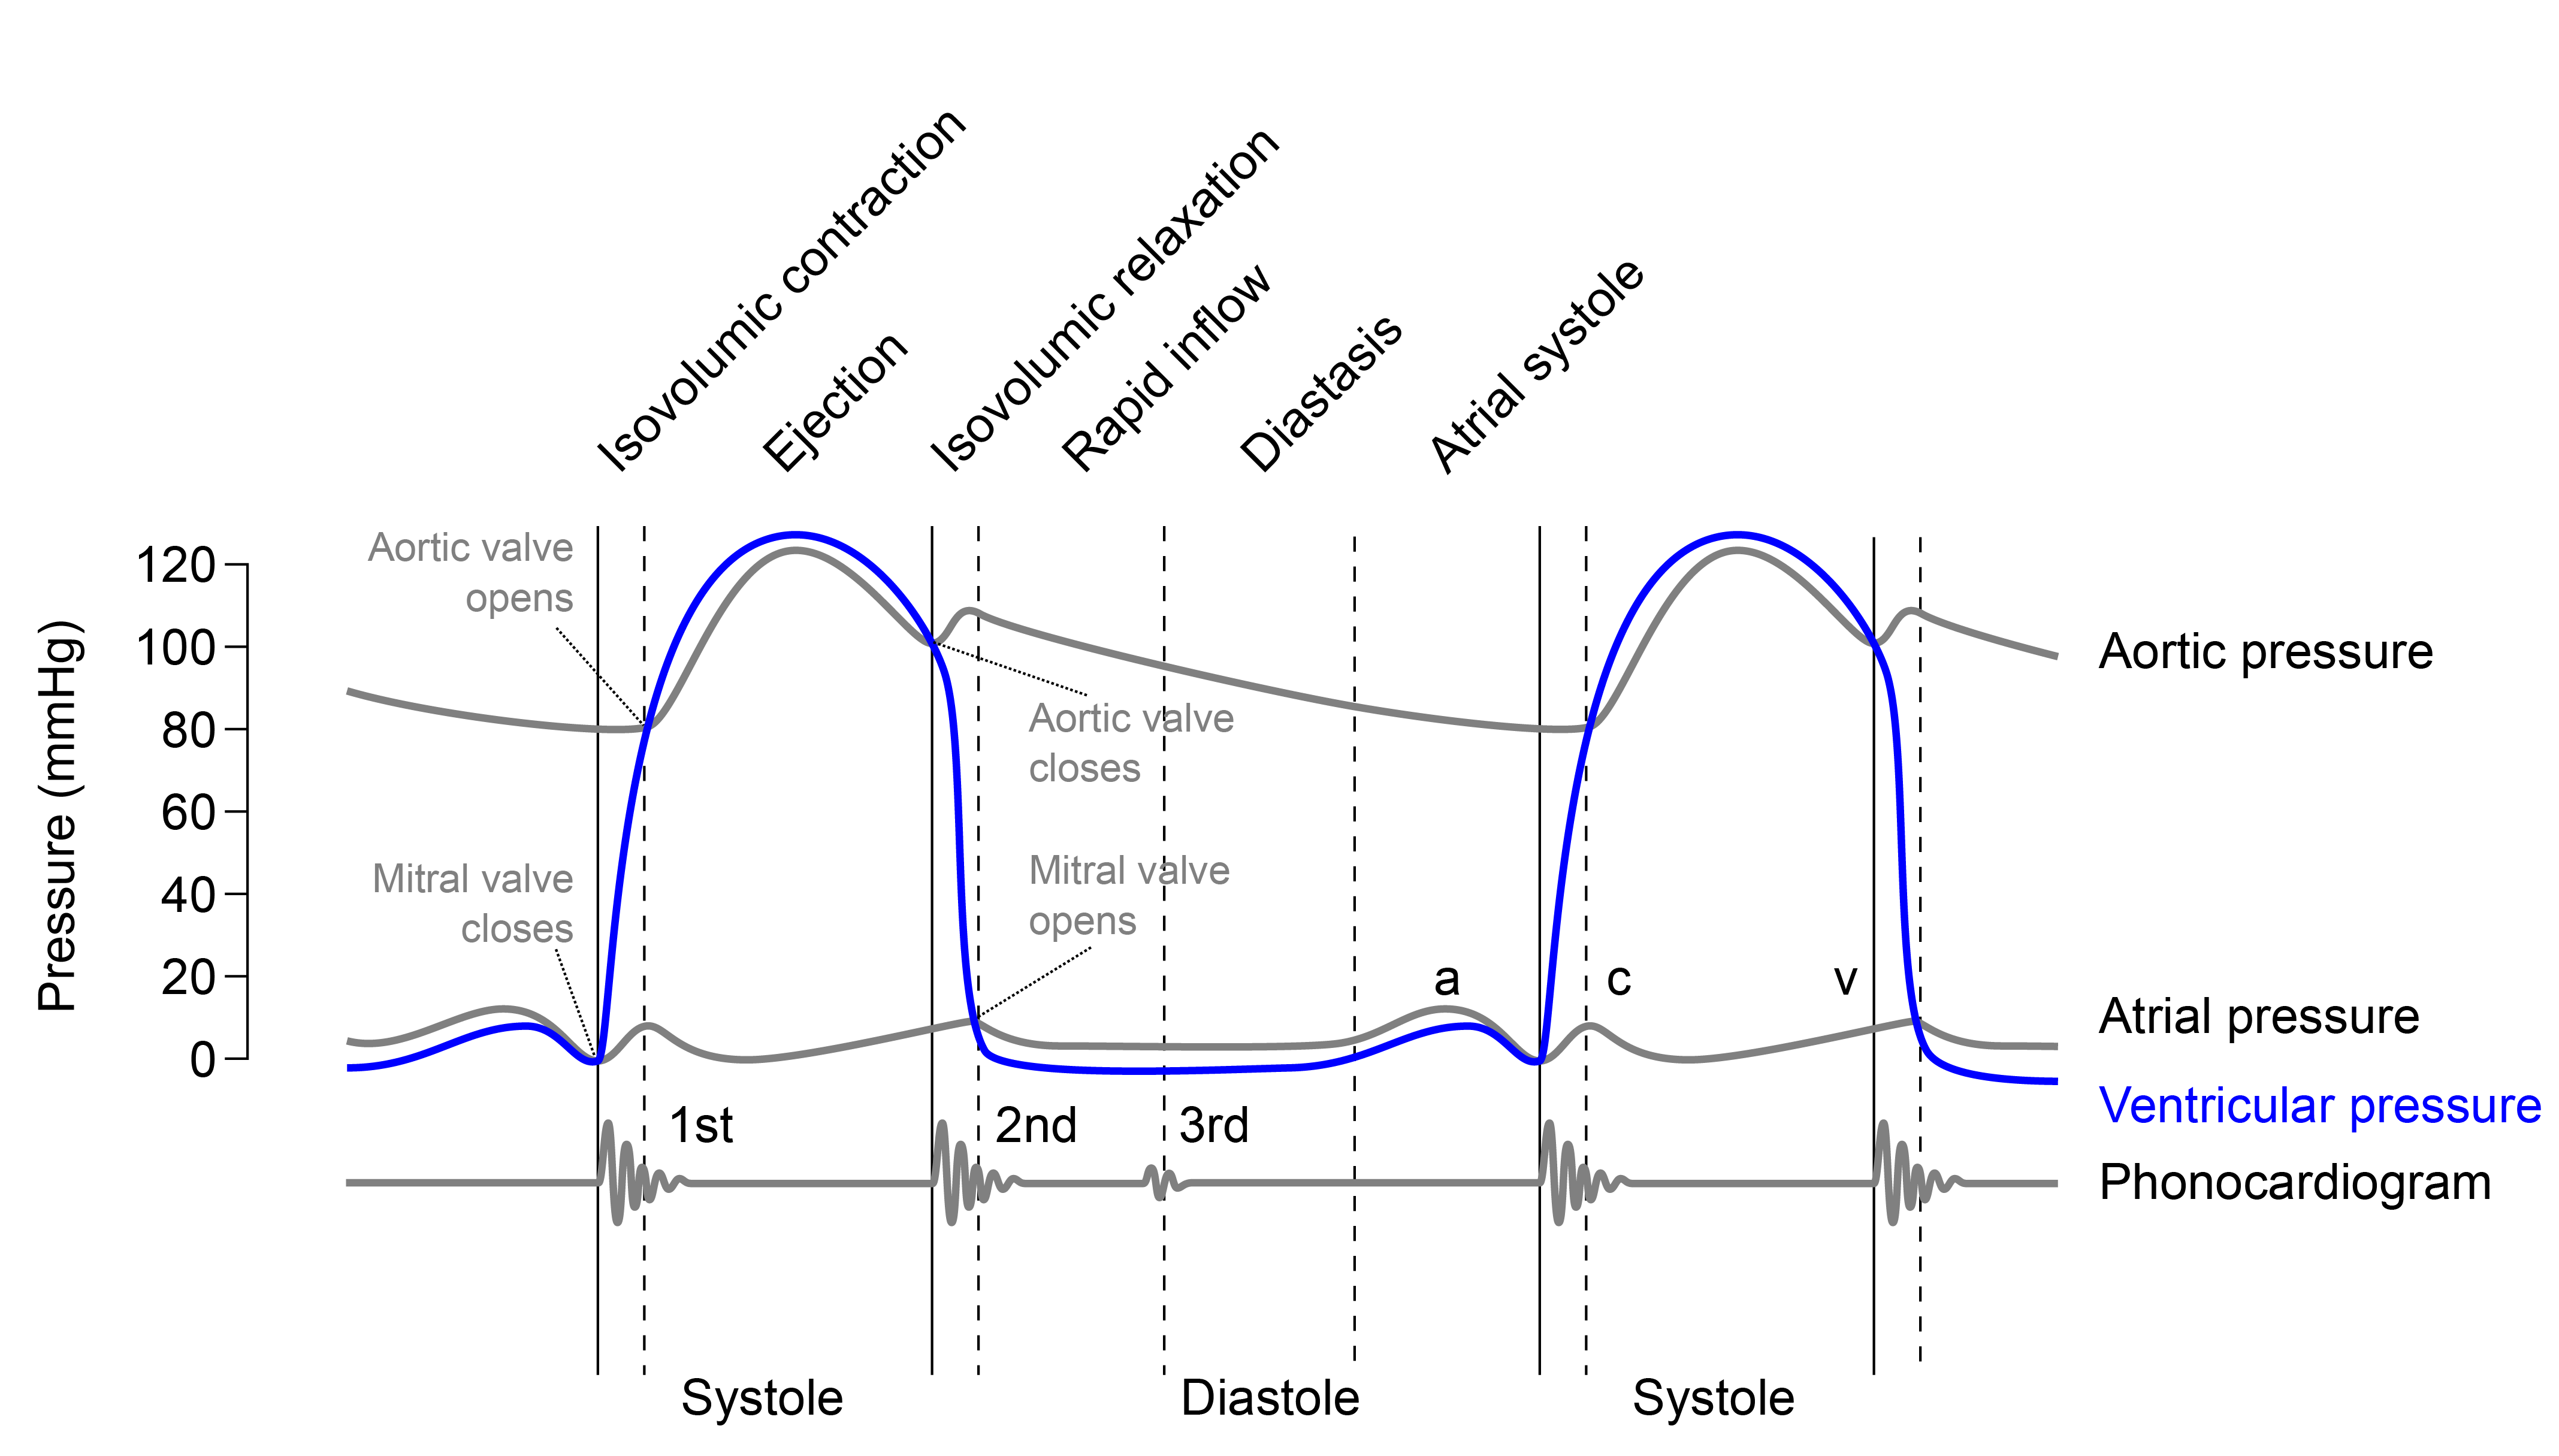
Consider the ventricle relaxed and filling, the phase termed diastole. Its pressure is low, about 8–12 mmHg, and the open AV valve admits blood from the atrium; a brief atrial contraction completes the filling. The ventricle now holds its maximum volume, the end-diastolic volume (EDV), roughly 130 mL in a resting adult (Betts et al. 2022).
The ventricle then contracts, beginning systole. Its pressure rises, and the instant it exceeds atrial pressure the AV valve closes, the first of the two audible events. For a brief interval both valves are shut: the AV valve has just closed, but ventricular pressure has not yet reached arterial pressure, so the semilunar valve remains closed. The muscle now compresses a sealed volume of incompressible blood, so the pressure rises steeply while the volume is fixed. This phase is isovolumic contraction (“same-volume”), the near-vertical climb in the figure.
The climb ends when ventricular pressure just exceeds aortic pressure (about 80 mmHg). The semilunar valve then opens and the ventricle ejects, driving blood into the aorta as its pressure peaks near 120 mmHg. Ejection is incomplete: the residual volume is the end-systolic volume (ESV), about 50–60 mL. The volume actually expelled on the beat is the stroke volume, the difference between the two:
\[\text{stroke volume} \;=\; \text{EDV} - \text{ESV} \;\approx\; 130 - 60 \;=\; 70\ \text{mL}.\]
The muscle then relaxes. Ventricular pressure falls, and the moment it drops below aortic pressure the semilunar valve closes, the second audible event. Both valves are again briefly shut while the pressure falls at constant volume (isovolumic relaxation), until it drops below atrial pressure, the AV valve reopens, and filling resumes. The complete loop takes about 0.8 seconds at a resting rate of 75 beats per minute.
Cardiac output
At rest the heart pumps about 5 liters of blood a minute (Betts et al. 2022), approximately the body’s entire blood volume each minute. This amounts to roughly 7,000 liters a day and, over an average lifetime, on the order of 200 million liters, delivered in some 2.5 to 3 billion beats without interruption. Blood travels through a vascular network that, laid end to end, would extend about 60,000 miles (twice the circumference of the Earth) (Betts et al. 2022). No manufactured pump operates for so long without maintenance.
A principal measure of the heart’s performance is the volume it pumps per minute, the cardiac output (CO). It is the product of two quantities already defined: the volume ejected per beat, the stroke volume (SV), and the number of beats per minute, the heart rate (HR).
A resting heart therefore operates at about \(\text{CO} = \text{HR}\times\text{SV} \approx 75\times70 = 5.25\) L/min (Betts et al. 2022). The formula also identifies the two independent means of increasing output: a higher rate or a larger stroke volume. During strenuous exercise a young adult may raise the heart rate to about 150 bpm and increase the stroke volume from 70 to roughly 130 mL; because the two factors multiply, output approaches 20 L/min (Betts et al. 2022), nearly four times the resting value.
The blood-pressure reading
The heart ejects in discrete pulses (a forceful ejection followed by a pause during refilling), yet blood reaches the periphery in a nearly steady stream. The smoothing agent is the aorta itself. The large arteries are elastic: during ejection the aortic wall distends and stores part of the ejected volume, and during diastole it recoils, driving that stored blood onward while the valve is shut. This elastic buffering is the Windkessel effect, named for the air chamber (“Windkessel”) of early hand-pumped fire engines, which converted a pulsatile pump into a continuous jet (Homan et al. 2023).
The Windkessel effect is the reason the cuff reports two pressures rather than one. Arterial pressure does not fall to zero between beats, because the recoiling aorta sustains it; it declines from a systolic peak of about 120 mmHg to a diastolic minimum of about 80 mmHg before the next beat, the familiar “120 over 80.” The difference between them is the pulse pressure,
\[\text{pulse pressure} \;=\; P_\text{systolic} - P_\text{diastolic} \;\approx\; 120 - 80 \;=\; 40\ \text{mmHg},\]
and this cyclic rise and fall, propagating outward through the arteries, is the pulse palpable at the wrist (Homan et al. 2023). The sphygmomanometer inflates until it can identify the pressure at which blood first passes the cuff (systolic) and the pressure at which flow becomes continuous again (diastolic). The two cuff numbers are thus direct readings of the pump.
Listening to valves
Consider again the stethoscope. The lub-dub is produced by the valves closing. When a valve closes, it abruptly arrests a moving column of blood, and the sudden deceleration launches a faint pressure wave through the surrounding tissue: a sound, which is itself a traveling pressure wave. The pressures that drive the cardiac cycle thus become audible at two particular instants.
The first sound, S1 (the “lub”) is the closure of the two AV valves (mitral and tricuspid) at the start of systole, as the ventricles begin to contract. The second sound, S2 (the “dub”) is the closure of the two semilunar valves (aortic and pulmonary) at the end of systole, as the ventricles relax (Betts et al. 2022; Pollock and Makaryus 2022). In Figure 2.4, S1 is marked where ventricular pressure first rises sharply (AV valve closing) and S2 where it falls back through the aortic pressure (semilunar valve closing). The lub-dub is therefore an audible record of two valve events, and the interval between a dub and the following lub is ventricular refilling. This is a genuine measurement: a trained listener can detect a leaking or narrowed valve as an additional sound (a murmur) superimposed on the normal ones. Its limitations are significant, however. Many serious conditions produce no audible sound, and those that do require extensive training to identify reliably.
Non-invasive monitoring
A heart valve can stiffen and narrow with age or disease, a condition called stenosis; the heart must then drive its entire stroke volume through a smaller opening, which it can do only by generating a larger pressure difference across the valve on every beat. That sustained excess pressure is what overloads and eventually damages the muscle. To diagnose stenosis, we need to measure the pressure drop across the valve. This pressure is difficult to measure directly, because it exists inside the sealed heart. A direct reading requires an invasive procedure that threads a catheter up an artery and across the valve.
Ultrasound is a noninvasive method that uses sound to image the body and measure the speed of blood as it moves. Building that instrument requires understanding waves, the physics of sound itself, which is developed next, followed by the ultrasound instrument that puts it to use. Once that instrument reports a velocity, one question remains: velocity is not pressure, and pressure is what a cardiologist actually needs. Converting one into the other requires two further conservation laws, developed in the sections that follow, and leads to the relation a cardiologist applies routinely, \(\Delta p \approx 4v^2\).