The base of the dermagraft is \(x/L = 0\) and the oxygenated surface is \(x/L = 1\).
The Thiele modulus \(\phi = R L^2/(2 D c_0)\) controls the shape of the curve. This section explores how the four physical parameters move the profile and computes the thickness at which that happens for a graft.
NoteCore concept
The steady-state oxygen profile inside the graft depends on four physical parameters, the diffusion coefficient \(D\), the volumetric consumption rate \(R\), the surface concentration \(c_0\), and the thickness \(L\). These are captured in a single dimensionless parameter, which we call the Thiele modulus\(\phi\). The name follows Thiele (Thiele 1939), who introduced the analogous group for first-order reactions in porous catalysts.
Exploring the parameters
Move one slider at a time in Figure 21.1 and watch \(\phi\) and the base value \(c(0)/c_0\) in the readout below the plot. Demand is \(R\) and \(L\), the rate at which cells consume oxygen and how deep they are piled; supply is \(D\) and \(c_0\), how easily oxygen moves and how much the medium holds. The curve depends on the four parameters only through \(\phi\), so any two settings with the same \(\phi\) give the same curve.
Show the code
viewof Rcons = Inputs.range([1e-5,0.3], {value:1.19e-3,transform:Math.log,label:"consumption rate R (mol/m³/s)",format: x => x.toExponential(2)})viewof Lum = Inputs.range([50,3000], {value:500,transform:Math.log,label:"thickness L (µm)",format: x => x.toFixed(0)})viewof Dnm = Inputs.range([0.3,6], {value:2,transform:Math.log,label:"diffusivity D (10⁻⁹ m²/s)",format: x => x.toFixed(2)})viewof Csurf = Inputs.range([0.02,0.25], {value:0.2,step:0.005,label:"surface oxygen c₀ (mol/m³)"})
Figure 21.1: Interactive oxygen profile \(c/c_0 = 1 + \phi((x/L)^2-1)\) for a graft with adjustable \(R\), \(L\), \(D\) and \(c_0\). The curve depends on the four sliders only through \(\phi\); the readout below the plot gives \(\phi\), the base value \(c(0)/c_0\), and the critical thickness \(L^{*}\).
Thickness is the strongest of the four levers. Because \(\phi \propto L^2\), a ten percent change in \(L\) moves \(\phi\) by twenty-one percent, roughly twice what a ten percent change in any of the other three does. It is also the one the engineer fixes directly at manufacture, whereas \(R\) rises if the seeded cells divide and the cell density grows. The model therefore favors thin constructs.
At and beyond the limit
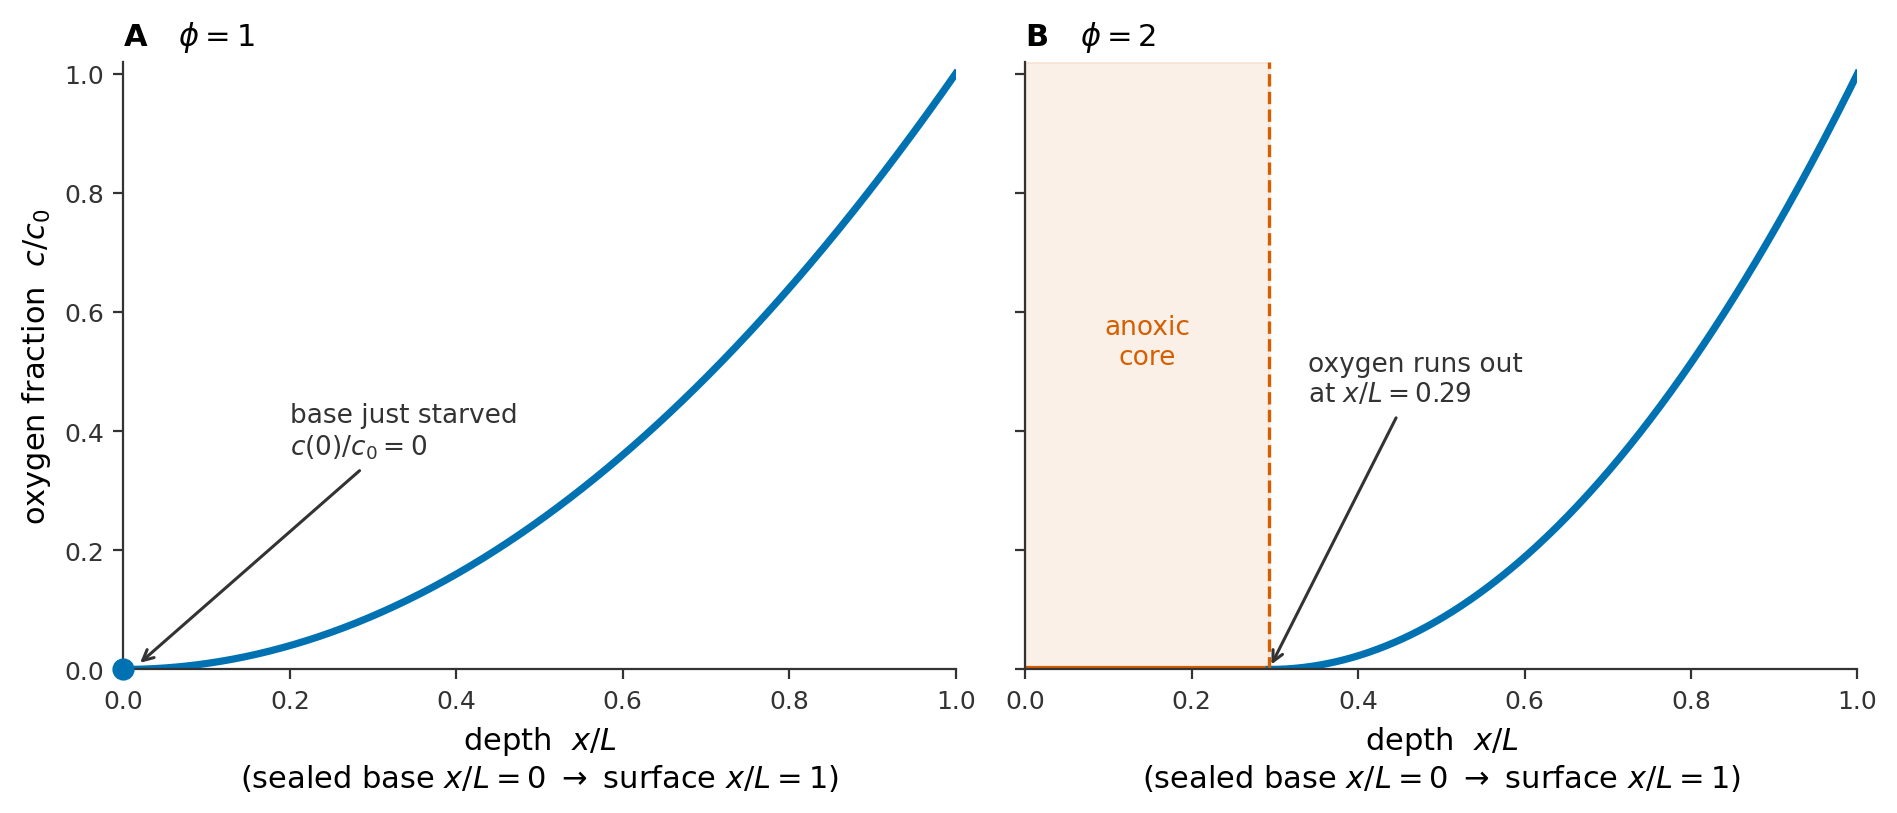
At \(\phi = 1\) the concentration of oxygen at the base of the graft falls to zero. The deepest layer of cells has exhausted its oxygen.
For \(\phi > 1\) oxygen ran out at some finite depth \(x_{\text{anox}}\), and below that depth there is nothing left to consume. The region below \(x_{\text{anox}}\) is an anoxic core. Figure 21.2 shows both cases.
NoteDerivation — where the anoxic core ends
The profile above assumed consumption at rate \(R\) all the way to the base, so its zero crossing is not the edge of the core. Below \(x_{\text{anox}}\) there is no oxygen and therefore no flux, so the live layer above it must meet the core with \(c = 0\) and \(\mathrm{d}c/\mathrm{d}x = 0\). Above \(x_{\text{anox}}\) the balance \(D\,\mathrm{d}^2c/\mathrm{d}x^2 = R\) still holds, and integrating it twice with those two conditions gives
The surface condition \(c(L) = c_0\) fixes the thickness of the live layer, \((L - x_{\text{anox}})^2 = 2Dc_0/R\). The right-hand side is the square of the critical thickness \(L^{*}\) found below, so
\[x_{\text{anox}} = L - L^{*} = L\left(1 - \frac{1}{\sqrt{\phi}}\right).\]
Figure 21.2: Two limit cases of the slab model. A, \(\phi = 1\): the profile just touches zero at the sealed base, so the deepest cells have exactly run out of oxygen. B, \(\phi = 2\): the live layer is \(L^{*} = L/\sqrt{2}\) thick, so oxygen runs out at \(x/L = 1 - 1/\sqrt{2} = 0.29\) and the bottom \(29\%\) of the graft holds no oxygen. Generated by scripts/gen_dermagraft_limit_cases.py.
Critical thickness
If we are concerned with making sure that all cells receive at least some oxygen, what is the thickest possible graft we can achieve? In this case, at \(x = 0\), the concentration is \(0\).
Evaluate the profile at the base. Setting \(x = 0\) gives
Solve for the thickness. Writing \(\phi\) out in full and setting it equal to one,
\[\frac{R L^2}{2 D c_0} = 1
\quad\Longrightarrow\quad
L^2 = \frac{2 D c_0}{R}
\quad\Longrightarrow\quad
L^{*} = \sqrt{\frac{2 D c_0}{R}} .\]
This \(L^{*}\) is the critical thickness. If the graft is any thicker, there will be an anoxic core.
From cells to a consumption rate
\(R\) is a volumetric rate, the moles of oxygen consumed per cubic meter of graft per second. What is measured in the laboratory is the per-cell oxygen consumption rate\(k_{\text{cell}}\), in moles per cell per second. The two are connected by the cell density\(\rho_{\text{cell}}\), the number of cells packed into each cubic meter:
For human dermal fibroblasts, \(k_{\text{cell}} \approx 1.19\times10^{-17}\ \text{mol/cell/s}\)(Streeter and Cheema 2011). Cell densities are quoted per mL, so they need converting first: a dense seeding of \(10^{8}\ \text{cells/mL}\) is
With \(D \approx 2\times10^{-9}\ \text{m}^2/\text{s}\)(Milo et al. 2010) and an air-saturated surface concentration \(c_0 \approx 0.2\ \text{mol/m}^3\)(Place et al. 2017),
or \(L^{*} \approx 0.82\ \text{mm}\). A graft seeded this densely cannot be thicker than about eight hundred micrometers without starving cells at its base.
ImportantKnowledge check
During culture, a graft’s fibroblasts proliferate until the cell density has quadrupled. By what factor does the critical thickness \(L^{*}\) change, and by what factor must the thickness be reduced to have the same Thiele modulus?
NoteAnswer
Quadrupling the density quadruples \(R\), and \(L^{*} = \sqrt{2 D c_0/R} \propto R^{-1/2}\), so \(L^{*}\) falls by \(\sqrt{4} = 2\), it is halved. To hold \(\phi = (L/L^{*})^2\) fixed as \(L^{*}\) halves, the thickness \(L\) must also be halved, since \(\phi\) depends only on the ratio \(L/L^{*}\).
Exercises
Unless stated otherwise, use \(D = 2\times10^{-9}\ \text{m}^2/\text{s}\)(Milo et al. 2010) and \(c_0 = 0.2\ \text{mol/m}^3\)(Place et al. 2017).
TipProblem 1
A graft is seeded with cells whose oxygen consumption rate is \(k_{\text{cell}} = 2.0\times10^{-17}\ \text{mol/cell/s}\), at a cell density \(\rho_{\text{cell}} = 5\times10^{7}\ \text{cells/mL}\).
Convert the cell density to cells per cubic meter.
Compute the volumetric consumption rate \(R\), and confirm its units are \(\text{mol}\,\text{m}^{-3}\text{s}^{-1}\).
NoteAnswer 1
There are \(10^{6}\ \text{mL}\) in a cubic meter, so
\(R = k_{\text{cell}}\times \rho_{\text{cell}} = (2.0\times10^{-17})(5\times10^{13}) = \mathbf{1.0\times10^{-3}\ \text{mol}\,\text{m}^{-3}\text{s}^{-1}}\). The units multiply as \(\dfrac{\text{mol}}{\text{cell}\cdot\text{s}} \times \dfrac{\text{cells}}{\text{m}^3} = \dfrac{\text{mol}}{\text{m}^3\cdot\text{s}}\): the cells cancel, leaving moles per cubic meter per second.
TipProblem 2
Using the consumption rate \(R = 1.0\times10^{-3}\ \text{mol}\,\text{m}^{-3}\text{s}^{-1}\) from Problem 1, compute the critical thickness \(L^{*}\) and state it in micrometers.
Only the top \(L^{*}\) of the graft stays oxygenated, so \(x_{\text{anox}} = L - L^{*} = 1.3 - 0.82 = \mathbf{0.48\ \text{mm}}\), which is \(0.48/1.3 = \mathbf{0.37}\) of the thickness. The bottom \(0.48\ \text{mm}\) of the graft, \(37\%\) of its depth, holds no oxygen. (Equivalently, \(x_{\text{anox}}/L = 1 - 1/\sqrt{\phi} = 1 - 1/\sqrt{2.5} = 0.37\).)
TipProblem 4
A structural requirement forces a graft to be exactly \(L = 1.0\ \text{mm}\) thick. The cells consume oxygen at \(k_{\text{cell}} = 1.19\times10^{-17}\ \text{mol/cell/s}\)(Streeter and Cheema 2011).
What volumetric consumption rate \(R\) puts this thickness exactly at \(\phi = 1\)?
What is the highest cell density, in cells/mL, that the graft can be seeded at?
NoteAnswer 4
Setting \(L = L^{*}\) and solving \(L^{*} = \sqrt{2 D c_0/R}\) for \(R\) gives \(R = 2 D c_0/L^2\):
which is \(6.7\times10^{13}/10^{6} = \mathbf{6.7\times10^{7}\ \text{cells/mL}}\), about a third below the \(10^{8}\ \text{cells/mL}\) of the nominal design. A thicker graft must be seeded more sparsely.
TipProblem 5
A graft is built at \(L = 0.6\ \text{mm}\) with the nominal DermaGraft parameters, \(R = 1.19\times10^{-3}\ \text{mol}\,\text{m}^{-3}\text{s}^{-1}\).
Compute the Thiele modulus \(\phi\).
Compute the oxygen fraction at the sealed base, \(c(0)/c_0\).
Compute the oxygen fraction halfway up the graft, at \(x = 0.3\ \text{mm}\), and convert it to a concentration in \(\text{mol/m}^3\).
At the base \(x = 0\), so \(c(0)/c_0 = 1 - \phi = 1 - 0.54 = \mathbf{0.46}\): the deepest cells see \(46\%\) of the surface oxygen. Since \(\phi < 1\) the base is still oxygenated, and at \(L = 0.6\ \text{mm}\) the graft sits well inside the \(L^{*} = 0.82\ \text{mm}\) ceiling.
Multiplying by the surface concentration, \(c = 0.60\,(0.2\ \text{mol/m}^3) = \mathbf{0.12\ \text{mol/m}^3}\). Note that the midpoint sits nearer the base value than the surface value, because the profile is quadratic in \(x\): most of the drop happens in the upper half of the graft.
References
Milo, Ron, Paul Jorgensen, Uri Moran, Griffin Weber, and Michael Springer. 2010. “BioNumbers—the Database of Key Numbers in Molecular and Cell Biology.”Nucleic Acids Research 38 (suppl_1): D750–53. https://doi.org/10.1093/nar/gkp889.
Place, Trenton L., Frederick E. Domann, and Adam J. Case. 2017. “Limitations of Oxygen Delivery to Cells in Culture: An Underappreciated Problem in Basic and Translational Research.”Free Radical Biology and Medicine 113: 311–22. https://doi.org/10.1016/j.freeradbiomed.2017.10.003.
Streeter, Ian, and Umber Cheema. 2011. “Oxygen Consumption Rate of Cells in 3D Culture: The Use of Experiment and Simulation to Measure Kinetic Parameters and Optimise Culture Conditions.”Analyst 136 (19): 4013–19. https://doi.org/10.1039/c1an15249a.
Thiele, Ernest W. 1939. “Relation Between Catalytic Activity and Size of Particle.”Industrial & Engineering Chemistry 31 (7): 916–20. https://doi.org/10.1021/ie50355a027.