10 The EKG
The electrocardiogram — EKG, from the German Elektrokardiogramm, or ECG — is the instrument that provides a recording of the depolarization wave. It measures the heart’s electrical activity using adhesive electrodes on the skin and displays the results as a voltage that changes with time. It is among the most frequently performed tests in medicine because it is inexpensive, rapid, and non-invasive. It reveals things that listening to a heart can not . This section examines what parts of the EKG trace represents.
As we learned, muscle and nerve cells are excitable: a signal can reverse their membrane voltage to positive (a depolarization), which can be recovered (repolarization). Muscle cells in the heart are electrically coupled. A depolarization in one cell spreads to its neighbors. A single depolarization consequently can propigate as a traveling wave of voltage across the muscle, with each region contracting after the wave passes. This moving pattern of electric charge, situated within a conductive, salt-rich body, produces a faint potential that reaches the skin. The EKG is the recording of that potential.
The SA node requires no external trigger; it is the heart’s clock, its natural pacemaker. The wave spreads across both atria, depolarizing them so that they contract and complete the filling of the ventricles. The signal converges on the atrioventricular (AV) node, the sole electrical connection between the atria and the ventricles. The AV node delays the wave for about a tenth of a second (Betts et al. 2022). This delay allows the atria to finish emptying before the ventricles are activated. The signal then travels through a fast-conducting pathway — the bundle of His, its two bundle branches, and the Purkinje fibers — that distributes it throughout both ventricles almost simultaneously, so that the large pumping chambers depolarize together and contract as a unit (Betts et al. 2022). Figure 10.1 labels every structure along this pathway, from the SA node in the right atrium to the Purkinje fibers of the ventricular walls.
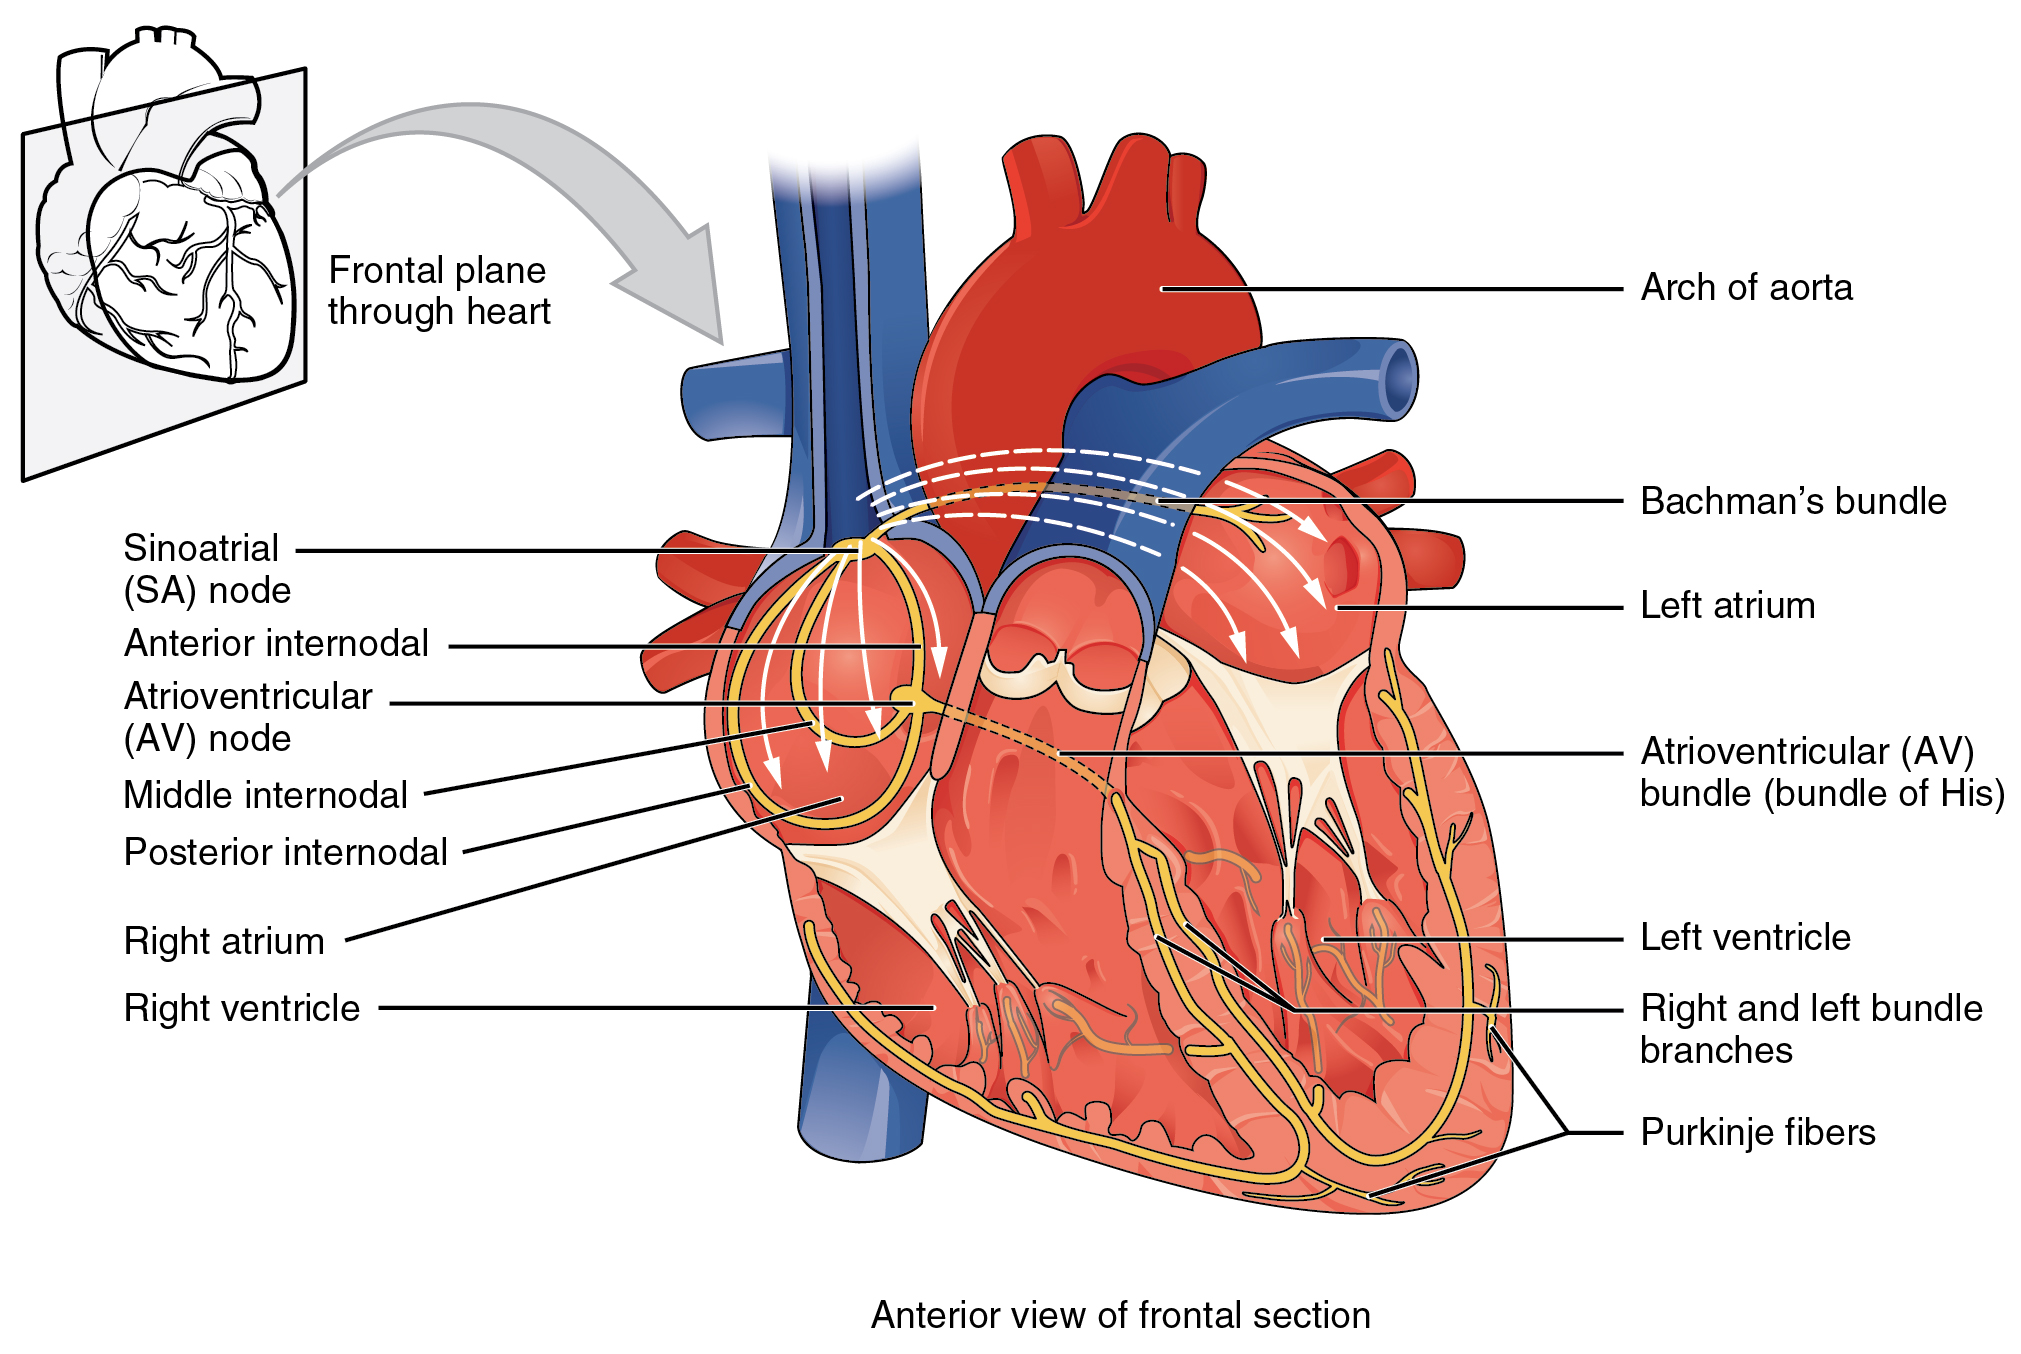
A heartbeat follows this normal sequence — SA-node activation, atrial depolarization, AV-node delay, ventricular depolarization — and is termed the sinus rhythm, which is the signature of a healthy, normally conducted beat. The term sinus denotes that the beat originated in the sinoatrial node. Most of what a clinician seeks on an EKG is a departure from this sequence: a beat originating outside the SA node, a wave blocked or delayed along its route, or a rate that is abnormally fast or slow. Let’s first establish a clear picture of the normal sequence as it appears on an EKG.
Figure 10.2 makes the link between the propagating wave and the trace. As the depolarization front (shaded) advances across the heart in each panel, the matching segment of the EKG trace beside it lights up in the same color.
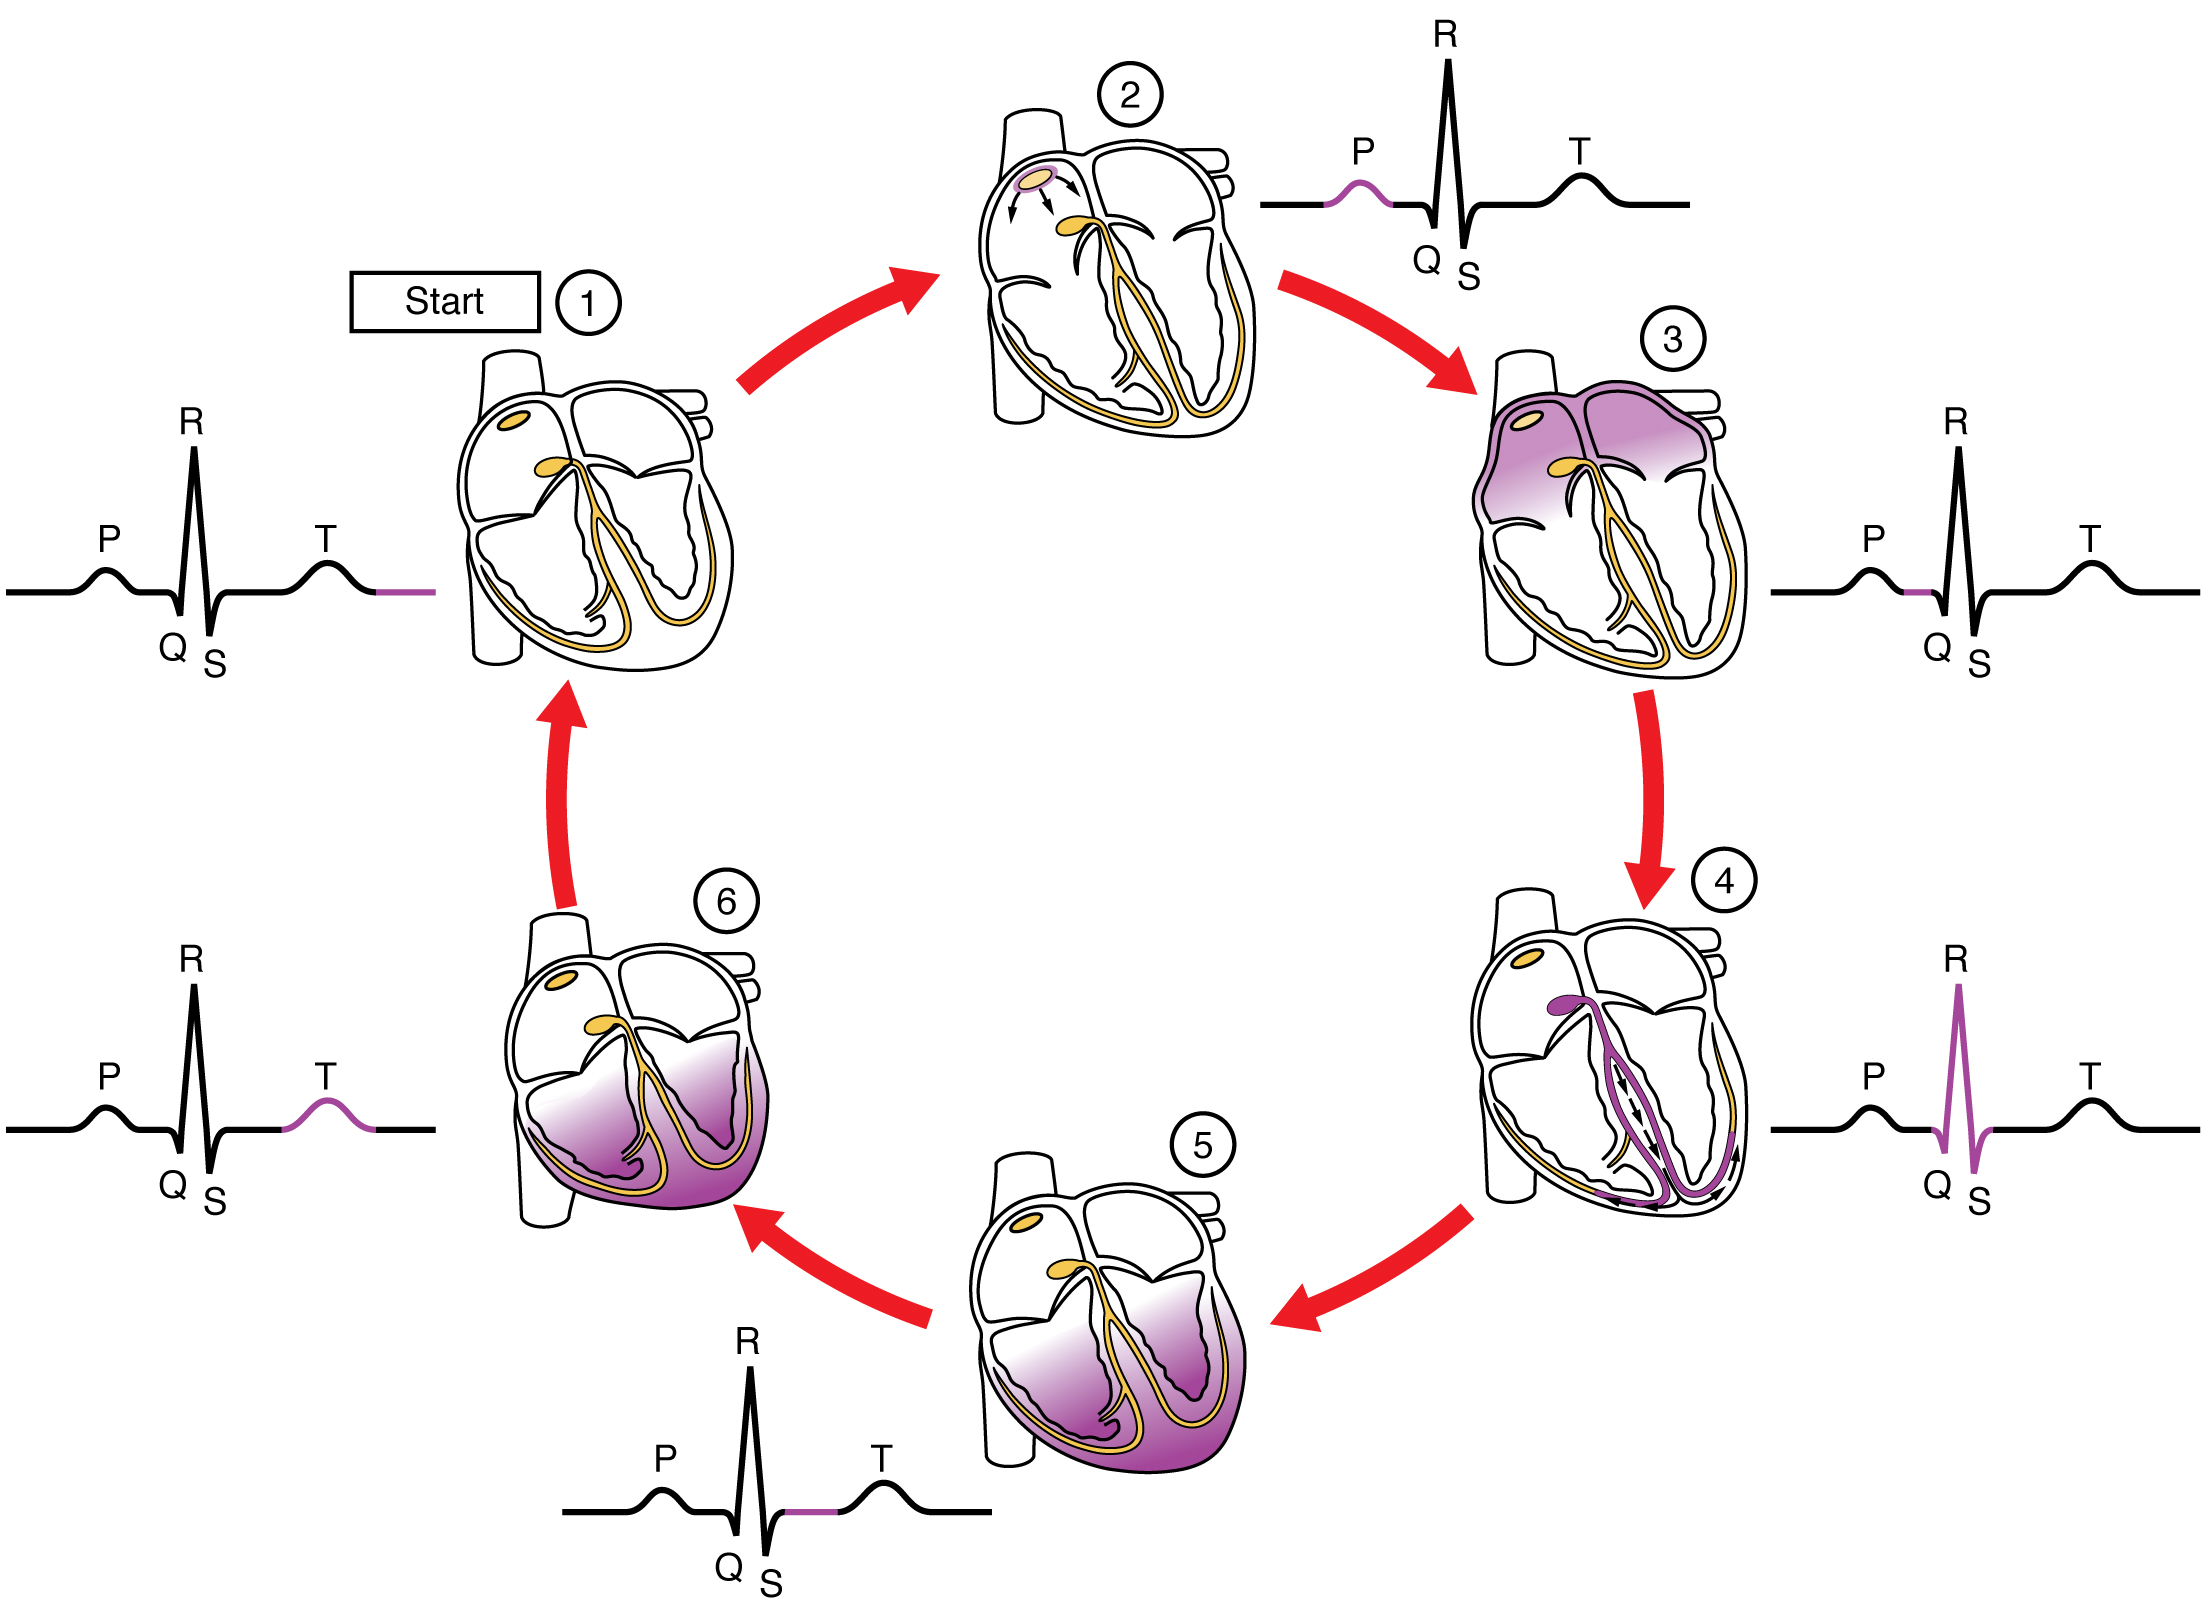
The shape of one beat: P, QRS, and T
One passage through the conduction system produces a small, highly characteristic waveform: a low deflection, then a tall narrow spike, then a rounded hump. More than a century ago these deflections were labeled, from left to right, P, then Q–R–S, then T, and the terminology has persisted. Each is the signature of a specific stage of the propagating wave (Figure 10.3).
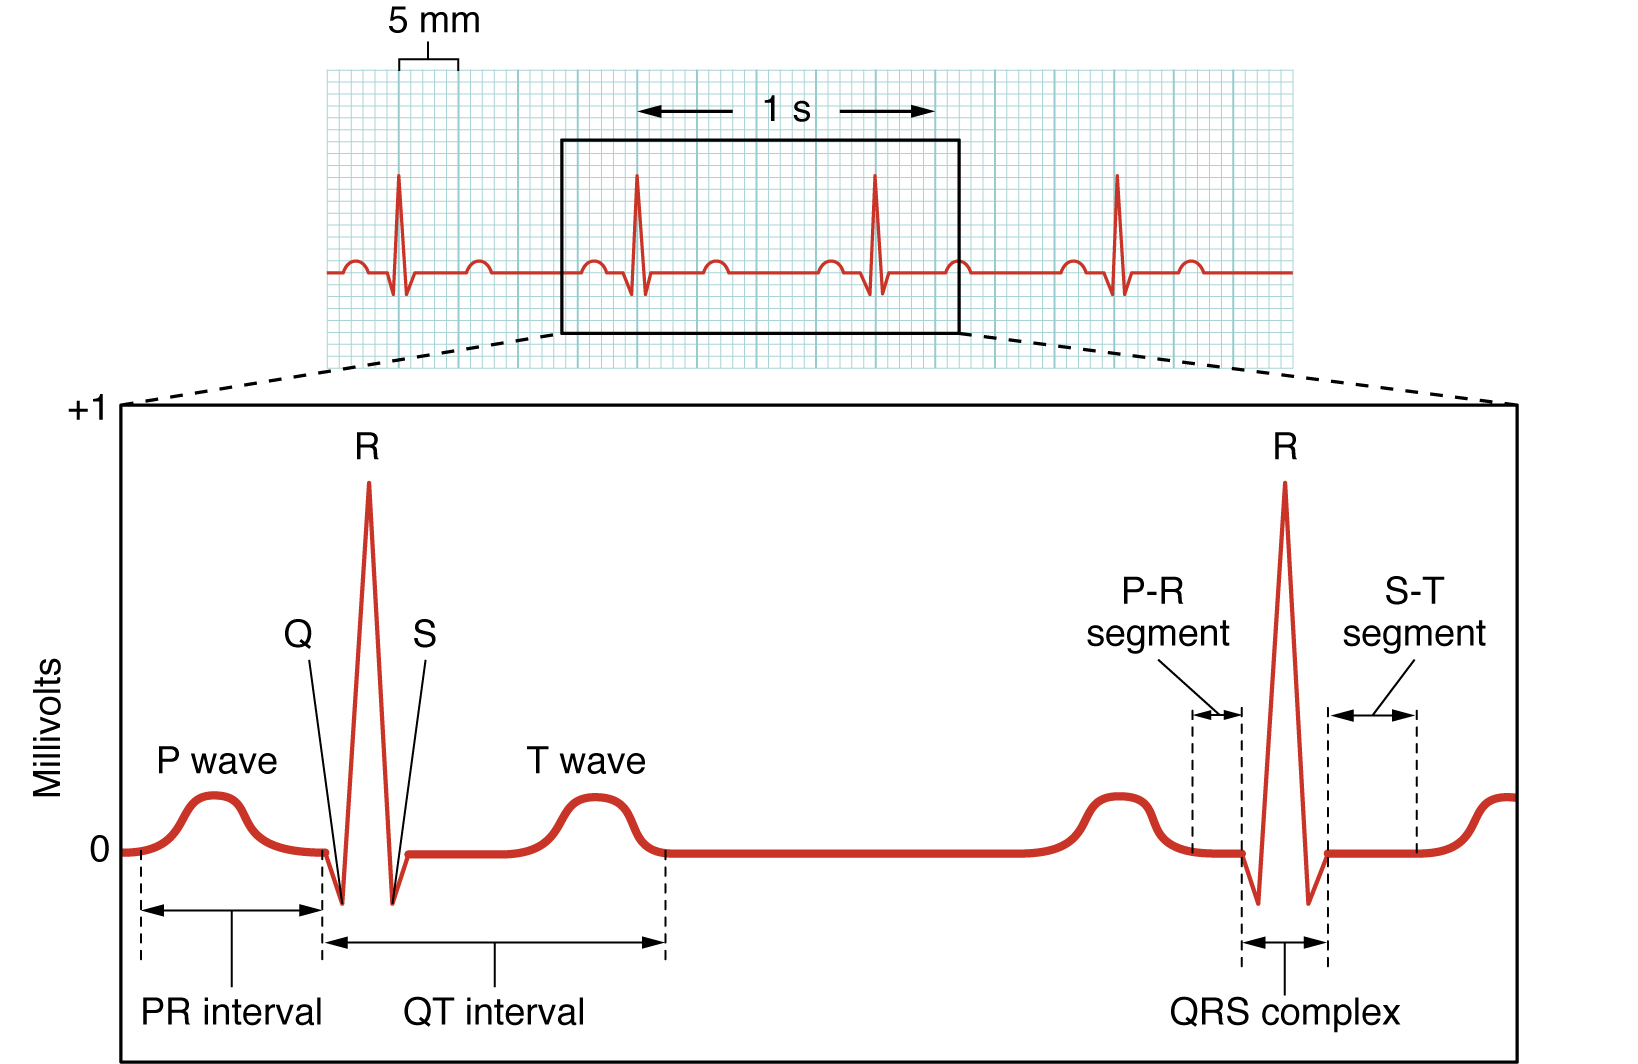
The P wave is the depolarization spreading across the atria, the atrial depolarization (Sattar and Chhabra 2023). It is small because the atria are thin-walled chambers with relatively little muscle, so the moving charge is modest. Shortly after the P wave the atria contract, providing the atrial contribution to ventricular filling described in the heart section.
The flat segment following the P wave (the PR interval) corresponds to the wave held at the AV node. Little charge is moving during this interval, so the trace is flat; it is the tenth-of-a-second delay rendered as a horizontal line. A normal PR interval is about 0.12 to 0.20 s (Sattar and Chhabra 2023). A substantially longer interval indicates that the AV node is conducting the signal too slowly.
The tall, sharp QRS complex is the wave propagating through the ventricles, the ventricular depolarization (Sattar and Chhabra 2023). It is large not because the ventricles are more electrically active than the atria, but because they contain far more muscle, so much more charge moves at once, and the Purkinje network activates it almost simultaneously, so there is a large voltage over a short time. Immediately after the QRS, the ventricles contract and eject blood into the aorta and pulmonary artery, the pressure event that opens the semilunar valves (see the heart section). A normal QRS is narrow, under about 0.12 s (Sattar and Chhabra 2023): a wide QRS indicates that the wave followed a slow, abnormal path through the ventricles rather than the fast Purkinje network. The atria repolarize during the QRS as well, but that small signal is obscured by the much larger ventricular deflection, so no separate atrial repolarization wave is observed.
Finally, the rounded T wave is ventricular repolarization. This occurs as the ventricular muscle restores its membrane voltage in preparation for the next beat (Sattar and Chhabra 2023). No distinct deflection marks the mechanical relaxation of the ventricles; relaxation follows repolarization. The interval from the start of the QRS to the end of the T wave, the QT interval, measures approximately how long the ventricles remain electrically active during each beat, normally about 0.40 to 0.44 s (Sattar and Chhabra 2023).
The intervals between these landmarks are used to diagnosis of different heart conditions.
| Feature | What it is | Normal value |
|---|---|---|
| P wave | atrial depolarization | small upward bump |
| PR interval | atrial firing + AV-node delay | 0.12–0.20 s |
| QRS complex | ventricular depolarization | < 0.12 s (narrow) |
| T wave | ventricular repolarization | rounded hump |
| QT interval | ventricular depolarization → repolarization | < ~0.44 s |
Reading a trace: rate and rhythm
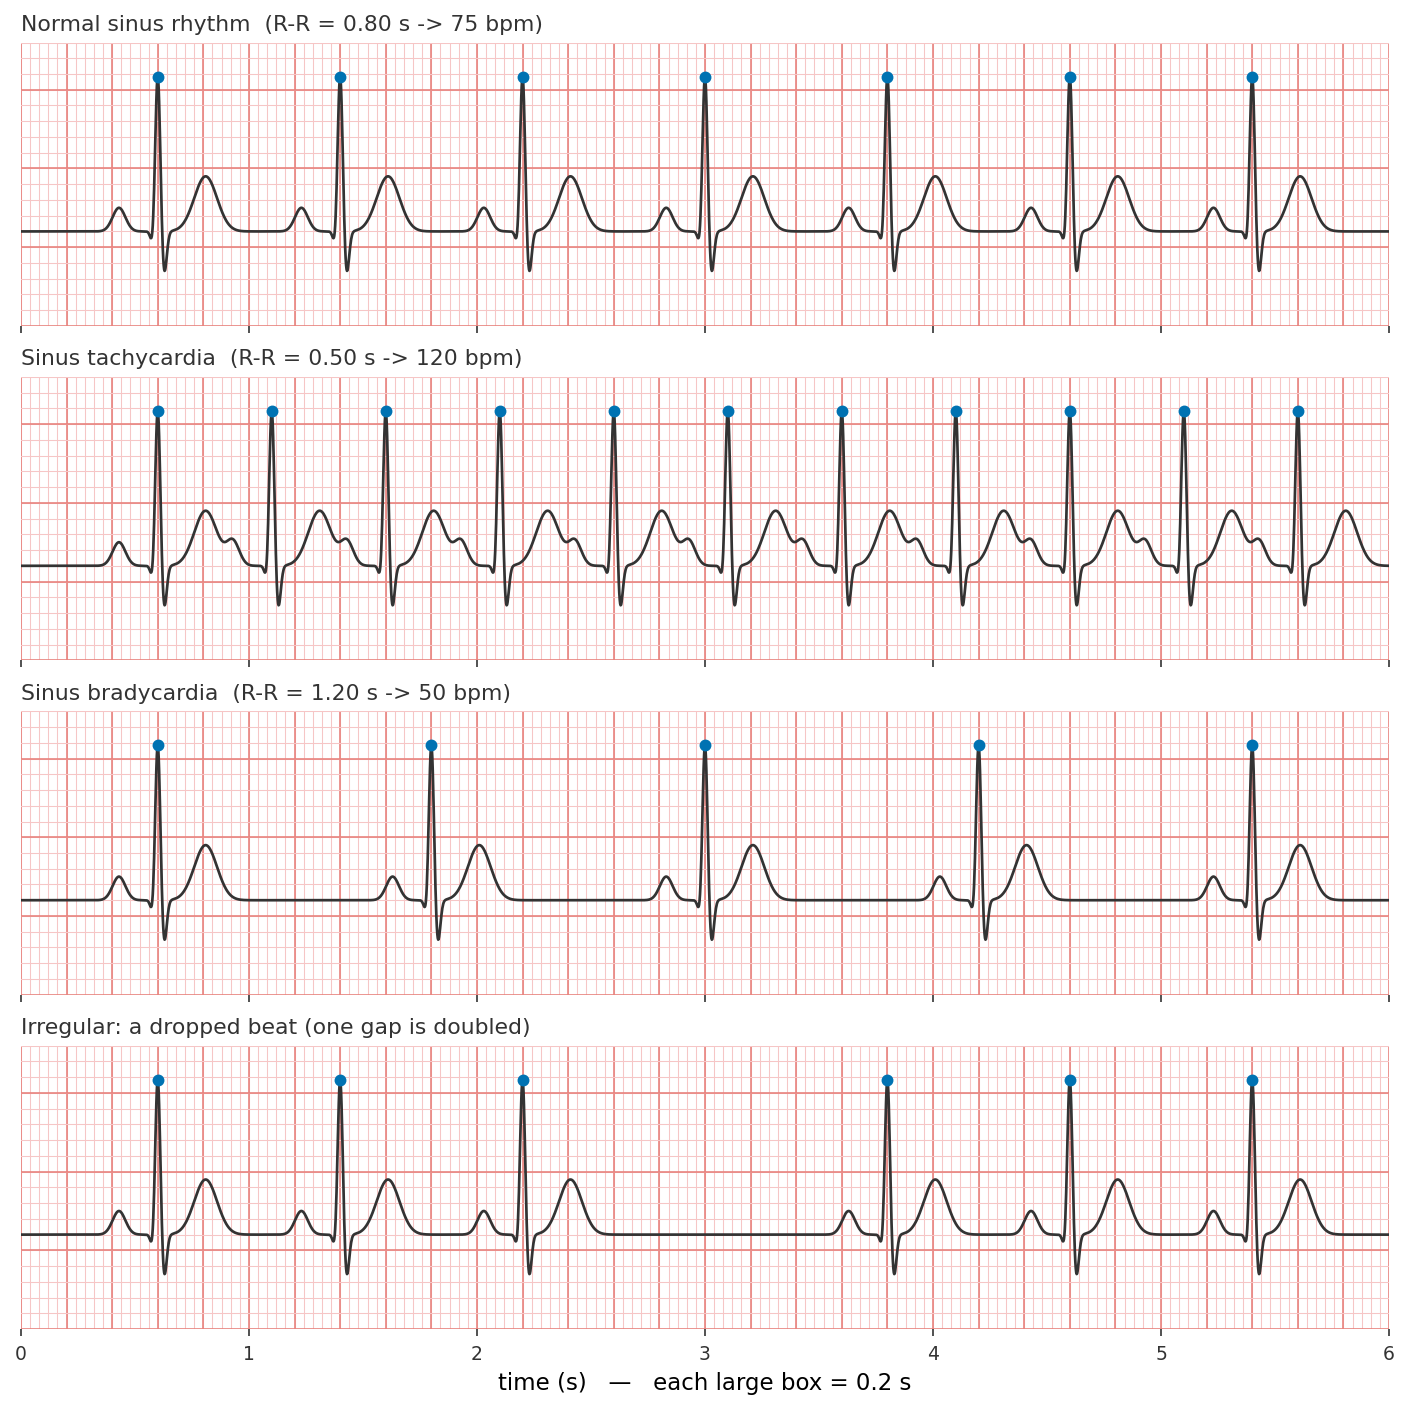
The EKG can give a lot of information, but one simple observation is how fast the heart is beating, and how regular the beats are. Both are determined from the spacing of the beats, and the R wave, which is the tallest and sharpest landmark on the trace. It is the natural reference point to measure between. The time from one R wave to the next, the R–R interval, is the duration of exactly one heartbeat (Figure 10.4).
scripts/gen_ekg_rhythm_strip.py.
Rate. Given the R–R interval in seconds, one beat takes \(T_{RR}\) seconds, so 60 seconds contain \(60 / T_{RR}\) beats. A beat every 0.8 s corresponds to \(60/0.8 = 75\) beats per minute.
Applying the rule, a resting heart whose R waves are four big boxes apart beats at \(300/4 = 75\) bpm — well within the normal range. The healthy range set by the SA node is about 60 to 100 bpm (Kashou et al. 2022; Sattar and Chhabra 2023). A rate above 100 is tachycardia (from Greek tachys, “fast”) and a rate below 60 is bradycardia (bradys, “slow”). Neither is necessarily pathological because the heart accelerates during exertion and slows at rest in trained endurance athletes. In Figure 10.4 the second strip is a sinus tachycardia (R waves 0.5 s apart, 120 bpm) and the third a sinus bradycardia (R waves 1.2 s apart, 50 bpm), each a normal-shaped, SA-node-driven beat that is simply fast or slow.
Rhythm. The rate is an average; rhythm concerns whether the beats are evenly spaced. Examining each successive R–R interval along the strip: if they are all essentially equal, the rhythm is regular; if they vary, it is irregular. A regular rhythm at a normal rate, with a P wave before every QRS, is normal sinus rhythm — the top strip in Figure 10.4. Irregularity is frequently where abnormality appears. The bottom strip shows the simplest case: the beats are evenly spaced and then one is absent, leaving a gap twice as wide as the others before the rhythm resumes (a dropped beat). The complementary abnormality is an extra, early beat that occurs before its expected time and shortens one interval. In both cases the indicator is the same: an R–R spacing that breaks the pattern.
The EKG is the body-surface recording of the depolarization wave that drives each heartbeat:
- The signal is a traveling wave of voltage. The SA node depolarizes at 60–100 bpm (sinus rhythm), and the wave propagates SA node → atria → AV node (a deliberate delay) → His–Purkinje → ventricles, each region contracting immediately after it depolarizes.
- One beat is P–QRS–T. The P wave is atrial depolarization, the QRS complex is ventricular depolarization, and the T wave is ventricular repolarization — each electrical event preceding the pressure event it commands.
- Rate and rhythm can be observed from the R–R spacing. On standard paper (25 mm/s), the rate is \(300 \div\) (big boxes) or \(1500 \div\) (small boxes) between R waves; even spacing indicates a regular rhythm, uneven spacing an irregular one.