34 The Kidney: Clearance and Urea Balance
A 60 kg woman whose kidneys have failed is connected to a dialysis machine. How long must the session run to remove enough urea? The clinical aim is to remove about 70% of the urea in one session, a dose written \(Kt/V = 1.2\) and defined below.
The body produces nitrogen-containing waste daily from the breakdown of protein. The dominant waste product is urea, a small, water-soluble molecule that becomes toxic when it accumulates. In a healthy person the kidneys filter urea and many drugs out of the blood and excrete them in urine, holding urea concentration steady. When the kidneys fail, urea and other wastes build up (a condition called uremia), and without intervention the concentration keeps rising. Hemodialysis replaces the missing function and lowers the concentration to a safe level within a few hours.
The body is modeled as a single well-mixed compartment with a urea mass balance, as in one-compartment drug models.
Urea, the kidney, and dialysis
Urea is the end product of protein metabolism. Protein the body does not need is broken down, and the nitrogen it releases is converted in the liver to urea, which is released into the blood and forms the largest circulating pool of waste nitrogen in the body (Weiner et al. 2015). On a typical protein intake an adult generates on the order of 20–30 g of urea per day; the rate is lower on the protein-restricted diets often prescribed in kidney disease (Weiner et al. 2015). This generation rate is denoted \(G\) and treated as constant, because it changes slowly compared with the processes below.
The kidneys are the principal organ of excretion for urea and for most water-soluble drugs (Grogan and Preuss 2023). Removal is described by the clearance \(CL\), the volume of blood cleared of a solute per unit time (mL/min or L/h). The rate of removal is proportional to the concentration:
\[\text{rate out} = CL \cdot C .\]
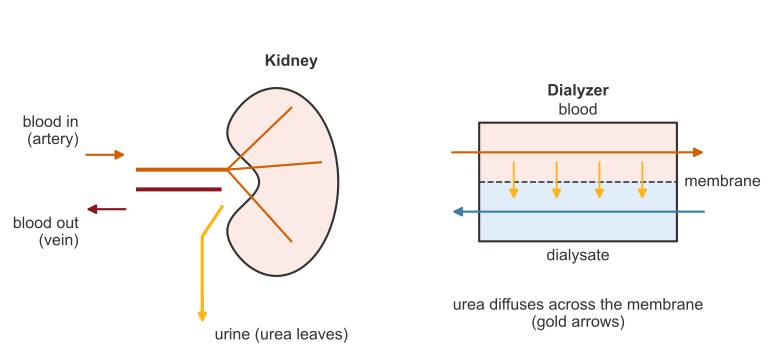
When the kidneys cannot remove enough urea, external filtration can. This is dialysis: blood flows past a semipermeable membrane, and urea diffuses across the membrane, down its concentration gradient, into a cleaning fluid called the dialysate. The dialyzer, the filter that holds the membrane, therefore adds an artificial clearance to whatever the kidneys still provide (Figure 34.1).
A mass balance on the body
A boundary is drawn around the body and everything that crosses it is tracked (Figure 34.2).
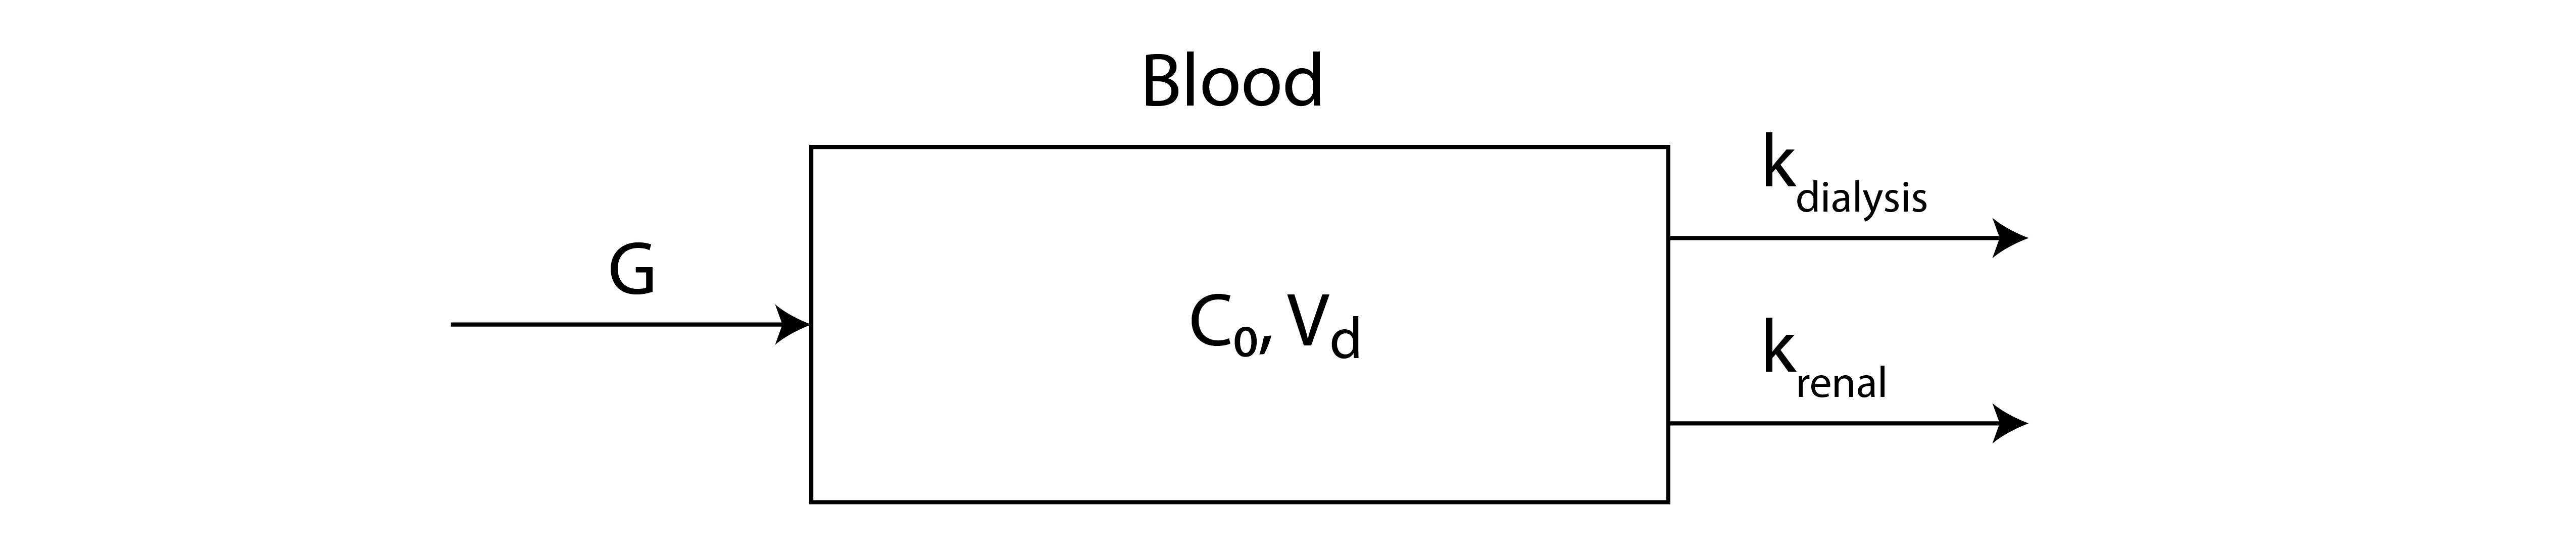
- The body is a single, well-mixed compartment: urea has the same concentration \(C\) everywhere in it. This is a 1-compartment model.
- The volume \(V_d\) is constant. (Dialysis also removes some water; this is neglected.)
- The liver is drawn outside the boundary, so the urea it makes enters as an input. No reaction makes or destroys urea inside the boundary.
The balance in words.
\[\frac{\Delta\,\text{urea}}{\Delta t} = \underbrace{\dot m_{\text{in}}}_{\text{generation by liver}} - \underbrace{\dot m_{\text{out}}}_{\text{dialysis + kidney}} + \underbrace{\text{reaction}}_{\text{none}}\]
The removal rates are first order. The amount of urea in the body is \(CV_d\) (concentration times volume). As for a drug, removal is first order: the amount removed per unit time is proportional to the amount present, so twice as much urea is removed twice as fast. The dialyzer and the kidney are two such routes acting at the same time:
Check the units. Every term must be in mg/h: \(G\) is already in mg/h, and \(k\,CV_d\) has units \(\frac{1}{\text{h}}\cdot\frac{\text{mg}}{\text{L}}\cdot\text{L} = \frac{\text{mg}}{\text{h}}\).
Two exits add. Both removal terms are proportional to \(CV_d\), so it can be factored out:
\[\frac{d(CV_d)}{dt} = G - (k_r + k_d)\,CV_d = G - k\,CV_d, \qquad k \equiv k_r + k_d \quad\text{(combined rate constant, 1/h).}\]
To keep the algebra short, define the total amount of urea \(U \equiv CV_d\) (units \(\frac{\text{mg}}{\text{L}}\cdot\text{L} = \text{mg}\)):
\[\frac{dU}{dt} = G - kU .\]
Solving the mass balance
Separate variables, then integrate. Every \(U\) moves to the left and every \(t\) to the right:
\[\frac{dU}{G - kU} = dt \qquad\Longrightarrow\qquad \int \frac{dU}{G - kU} = \int dt .\]
Integrating leaves one constant of integration, \(c\):
\[-\frac{1}{k}\ln|G - kU| = t + c .\]
Multiplying by \(-k\) and exponentiating gives \(|G - kU| = e^{-kc}\,e^{-kt}\). The absolute value allows either sign, so the result can be written with a single constant \(B\) that may be positive or negative:
\[G - kU = B\,e^{-kt} .\]
Initial condition. At \(t = 0\), the amount of urea is \(U(0) = U_0\). Since \(e^{0} = 1\):
\[B = G - kU_0 .\]
Substituting \(B\) back in and solving for \(U\):
\[G - kU = (G - kU_0)\,e^{-kt} \quad\Longrightarrow\quad U(t) = \frac{G}{k} - \left(\frac{G}{k} - U_0\right)e^{-kt} = \frac{G}{k} + \left(U_0 - \frac{G}{k}\right)e^{-kt} .\]
Since \(U(t) = C(t)\,V_d\) (mass of urea = concentration of urea \(\times\) volume), dividing by \(V_d\) with \(C_0 = U_0/V_d\) gives the concentration:
Nephrology calls this one-compartment model the single-pool model and uses it to judge whether a session removes enough urea (Gotch 2001; Locatelli et al. 2005).
The shape of the curve
- At \(t = 0\): \(e^{0} = 1\), so \(C(0) = C_0\).
- As \(t \to \infty\): \(e^{-kt} \to 0\), so \(C(\infty) = \dfrac{G}{kV_d}\).
In between, the gap between \(C\) and \(G/(kV_d)\) decays as \(e^{-kt}\). Urea approaches the steady state \(G/(kV_d)\) exponentially (Figure 34.3).
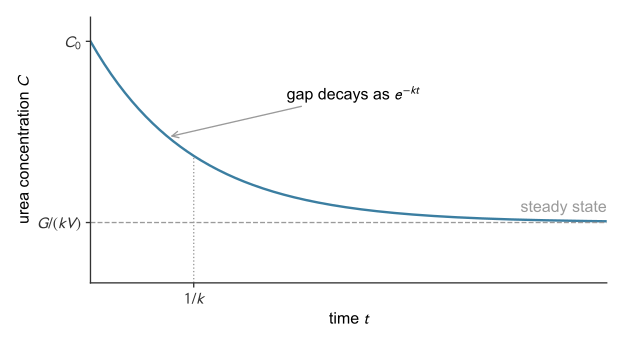
The steady state, directly. The plateau can be found without solving anything. At steady state the concentration stops changing, \(d(CV_d)/dt = 0\), so \(0 = G - kC_{\text{ss}}V_d\) and
\[C_{\text{ss}} = \frac{G}{kV_d} = \frac{G}{CL_{\text{tot}}},\]
where \(CL_{\text{tot}} = V_d(k_r + k_d)\) is the total clearance: the removal rates add, so the rate constants add, and clearances in parallel add. At steady state, removal (\(kCV_d\)) exactly balances generation (\(G\)). This is the steady-state relation for drug infusions in one-compartment models, with urea generation in place of the infusion rate. The steady state is inversely proportional to clearance: doubling the clearance halves it.
How fast? The exponent \(kt\) must be unitless, so \(1/k\) has units of time. It is called the time constant, \(\tau = 1/k\). After one time constant, \(e^{-1} = 0.37\), so the concentration has covered 63% of the distance from \(C_0\) to the steady state. After \(3\tau\) it has covered 95%. The half-life of the one-compartment model, \(t_{1/2} = \ln 2/k\), is also set by \(k\).
The volume of distribution of urea
Urea is small, uncharged, and very water soluble, so it spreads through the water in the body, inside cells as well as outside. Its volume of distribution \(V_d\) is therefore the total body water (TBW): the volume that holds the urea at the common concentration \(C\). It is taken as constant (Gotch 2001). On average,
\[\text{TBW} \approx 0.60~\text{L/kg (men)}, \qquad \text{TBW} \approx 0.50~\text{L/kg (women)} .\]
For a 70 kg man, \(V_d = 0.60 \times 70 = 42\) L. The model also assumes that equilibrium is instantaneous: as dialysis removes urea from the blood, urea from the rest of the body water moves into the blood immediately.
A clearance and a rate constant are linked through this volume: \(k = CL/V_d\), so \(k_r = CL_r/V_d\) for the kidney.
Steady state in numbers
With a generation rate of \(G = 1000\) mg/h (24 g/day), healthy kidneys with a renal clearance \(CL_r\) (the subscript marks renal) of about 3.6 L/h (60 mL/min) hold the blood at
\[C_{\text{ss}} = \frac{1000}{3.6} \approx 278\ \text{mg/L},\]
a normal, non-toxic level. If disease drops the renal clearance to \(CL_r \approx 0.6\) L/h (10 mL/min), the same generation drives the steady state to
\[C_{\text{ss}} = \frac{1000}{0.6} \approx 1670\ \text{mg/L},\]
roughly six times higher, and uremic. The steady state is lowered by reducing \(G\) (a protein-restricted diet) or raising the clearance (dialysis).
Urea removal, clearance, and \(Kt/V\)
For a patient, the goal is a target fraction remaining: the fraction of the starting urea that is still there at the end of the session,
\[R = \frac{C_{\text{post}}}{C_{\text{pre}}},\]
where \(C_{\text{pre}}\) is measured before the session and \(C_{\text{post}}\) after it. Clinics often report the urea reduction ratio (URR), the fraction removed: \(\text{URR} = 1 - R\).
Neglecting generation during the session. During dialysis, generation is small compared with removal, \(G \ll kC_0V_d\), so \(G \approx 0\). The first term of the solution then vanishes, leaving
\[C(t) = C_0\,e^{-kt} .\]
Residual kidney function is neglected during the session, so all removal is by the dialyzer and \(k = k_d\). This is the standard single-pool description of a short session (Dębowska et al. 2011). Section 34.10 quantifies the error: for the 4 h session in Table 34.1, setting \(G = 0\) at \(G = 1000\) mg/h makes the computed end-of-session concentration about 12% too low.
Clearance: removal measured as a volume per time. The dialyzer’s performance is usually not given as a rate constant \(k\) (units 1/h) but as a clearance \(K\) (units mL/min or L/h) (Locatelli et al. 2005). Clearance is the volume of blood that the dialyzer completely clears of urea per unit time. If the dialyzer clears \(K\) liters per hour of blood at concentration \(C\), it removes urea at the rate
\[\text{removal rate} = K\,C \qquad \left[\tfrac{\text{L}}{\text{h}}\cdot\tfrac{\text{mg}}{\text{L}} = \tfrac{\text{mg}}{\text{h}}\right].\]
In the model the same removal rate is \(k\,CV_d\). Setting the two equal:
The rate constant is the clearance divided by the volume the urea is spread through: a dialyzer clears a fixed volume of blood each minute, and the larger the body’s pool, the smaller the fraction of it that volume represents. Clearance is written \(CL\) in general, \(CL_r\) for the kidney, and \(K\) for the dialyzer. Lowercase \(k\) is a rate constant, and the total clearance is \(CL_{\text{tot}} = CL_r + K = kV_d\).
Substituting \(k = K/V_d\):
\[C(t) = C_0\,e^{-(K/V_d)\,t} \qquad\Longrightarrow\qquad R = \frac{C(t)}{C_0} = e^{-Kt/V_d} \qquad\Longrightarrow\qquad \ln R = -\frac{Kt}{V_d}\]
The quantity \(Kt/V\) was introduced in the analysis of the National Cooperative Dialysis Study (Gotch and Sargent 1985).
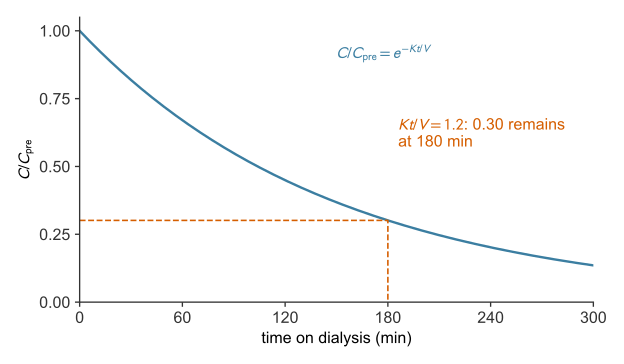
The clinical target. Dialysis prescriptions are written as a target value of \(Kt/V\). For patients dialyzed three times a week, the current U.S. guideline sets \(Kt/V = 1.2\) per session as the minimum delivered dose and recommends aiming somewhat higher (National Kidney Foundation 2015). At \(Kt/V = 1.2\) the fraction of urea remaining is \(R = e^{-1.2} \approx 0.30\), so the session removes about 70%, within the 65–70% reduction that guidelines associate with adequate dialysis (Locatelli et al. 2005). The target is chosen from clinical outcomes, not derived from the model. Clinics calculate \(Kt/V\) with a more complete version of this model that includes urea generation and the water removed during the session (Daugirdas 1993); the model here omits both.
Measuring clearance from two blood samples. Neglecting generation, \(\ln C = \ln C_0 - kt\), so two urea measurements, \(C_1\) and then \(C_2\), taken \(\Delta t\) apart give the rate constant, \(k = \ln(C_1/C_2)/\Delta t\). The delivered clearance then follows from \(K = kV_d\).
Example: how long must the session run?
Back to the question
For the 60 kg woman with a 200 mL/min dialyzer, reaching the target \(Kt/V = 1.2\) takes 180 min, about 3 hours, and leaves 30% of the urea.
Optional: how good is \(G \approx 0\)?
The liver keeps producing urea during the session, so setting \(G = 0\) makes the computed end-of-session concentration too low. Table 34.1 compares the solution with generation and the \(G = 0\) solution for a 4 h session with \(C_0 = 1400\) mg/L, dialyzer clearance \(K = kV_d = 12.5\) L/h (residual kidney function neglected), and \(V_d = 42\) L, a separate case from the example above. The solution with generation is \(C(t) = G/(kV_d) + (C_0 - G/(kV_d))\,e^{-kt}\), and the initial removal rate is \(kV_dC_0 = 17{,}500\) mg/h.
| \(G\) (mg/h) | \(G/(kV_dC_0)\) | \(C_{\text{post}}\) with \(G\) (mg/L) | \(C_{\text{post}}\) with \(G = 0\) (mg/L) | underestimate from \(G = 0\) |
|---|---|---|---|---|
| 500 | 2.9% | 454 | 426 | 6.1% |
| 1000 | 5.7% | 481 | 426 | 11.6% |
| 1500 | 8.6% | 509 | 426 | 16.4% |
| 2000 | 11.4% | 537 | 426 | 20.7% |
In Figure 34.5, the slider sets \(G\) for the session in Table 34.1. The solid curve includes generation and the dashed curve sets \(G = 0\). The sentence below the plot reports the end-of-session concentration and urea reduction ratio both ways, and the gap between them; at \(G = 1000\) mg/h it reproduces the second row of the table.
The underestimate is zero at \(G = 0\) and grows with \(G\) and with time in the session, because the removal rate \(kCV_d\) falls as \(C\) falls while \(G\) stays fixed. At \(G = 1000\) mg/h it is 1.9% after 1 h, 4.4% after 2 h, and 11.6% after 4 h. At the end of the session, the urea reduction ratio is 69.6% with \(G = 0\) and 65.6% with \(G = 1000\) mg/h.
Exercises
Problem 1 uses the dialysis example above. The remaining problems take the urea distribution volume as \(V_d = 42~\text{L}\) (total body water of a \(70~\text{kg}\) adult) unless stated otherwise, and express concentrations in mg/L. Recall \(C_{\text{ss}} = G/(V_d k)\), \(C(t) = C_0 e^{-kt}\) for the no-generation case, \(t_{1/2} = \ln 2 / k\), and \(CL = k V_d\). Evaluate \(e^{x}\) and \(\ln x\) with Python (np.exp, np.log) or a scientific calculator; see the Python and calculus appendices.
References
Daugirdas, John T. 1993. “Second Generation Logarithmic Estimates of Single-Pool Variable Volume Kt/V: An Analysis of Error.” Journal of the American Society of Nephrology 4 (5): 1205–13. https://doi.org/10.1681/ASN.V451205.
Dębowska, Małgorzata, Bengt Lindholm, and Jacek Waniewski. 2011. “Kinetic Modeling and Adequacy of Dialysis.” In Progress in Hemodialysis – from Emergent Biotechnology to Clinical Practice, edited by Angelo Carpi, Carlo Donadio, and Gianfranco Tramonti. IntechOpen. https://doi.org/10.5772/24771.
Gotch, Frank A. 2001. “Evolution of the Single-Pool Urea Kinetic Model.” Seminars in Dialysis 14 (4): 252–56. https://doi.org/10.1046/j.1525-139X.2001.00064.x.
Gotch, Frank A., and John A. Sargent. 1985. “A Mechanistic Analysis of the National Cooperative Dialysis Study (NCDS).” Kidney International 28 (3): 526–34. https://doi.org/10.1038/ki.1985.160.
Grogan, Sean, and Charles V. Preuss. 2023. “Pharmacokinetics.” In StatPearls. StatPearls Publishing. https://www.ncbi.nlm.nih.gov/books/NBK557744/.
Locatelli, Francesco, Umberto Buoncristiani, Bernard Canaud, et al. 2005. “Dialysis Dose and Frequency.” Nephrology Dialysis Transplantation 20 (2): 285–96. https://doi.org/10.1093/ndt/gfh550.
National Kidney Foundation. 2015. “KDOQI Clinical Practice Guideline for Hemodialysis Adequacy: 2015 Update.” American Journal of Kidney Diseases 66 (5): 884–930. https://doi.org/10.1053/j.ajkd.2015.07.015.
Weiner, I. David, William E. Mitch, and Jeff M. Sands. 2015. “Urea and Ammonia Metabolism and the Control of Renal Nitrogen Excretion.” Clinical Journal of the American Society of Nephrology 10 (8): 1444–58. https://doi.org/10.2215/CJN.10311013.