35 Iodine Metabolism
The thyroid gland concentrates iodine. It draws iodide from the bloodstream through the sodium–iodide symporter, a membrane protein that co-transports the two ions into the cell. It can raise the iodide concentration inside the gland to roughly forty times the level in plasma, where the iodine is built into thyroid hormone (Pappaconstantinou et al. 2025). This avidity is the basis of a standard radiation-safety practice. A worker who handles radioactive iodine (for example Iodine-125, a common laboratory tracer) and suspects an accidental exposure can be tested: after enough time has passed for ingested iodine to move from the bloodstream into the thyroid, the gland is scanned for radioactivity (Pappaconstantinou et al. 2025). The same avidity is used in therapy: radioiodine delivered to an overactive or cancerous gland concentrates its dose in the gland (Choudhury and Gupta 2018).
How long after a suspected exposure should one wait before scanning the thyroid? Scan too early and little of the iodine has reached the gland; wait too long and the model that follows no longer applies. A model of how iodine moves from the blood into the thyroid over time answers it, using the compartmental method of the one-compartment model extended to two compartments.
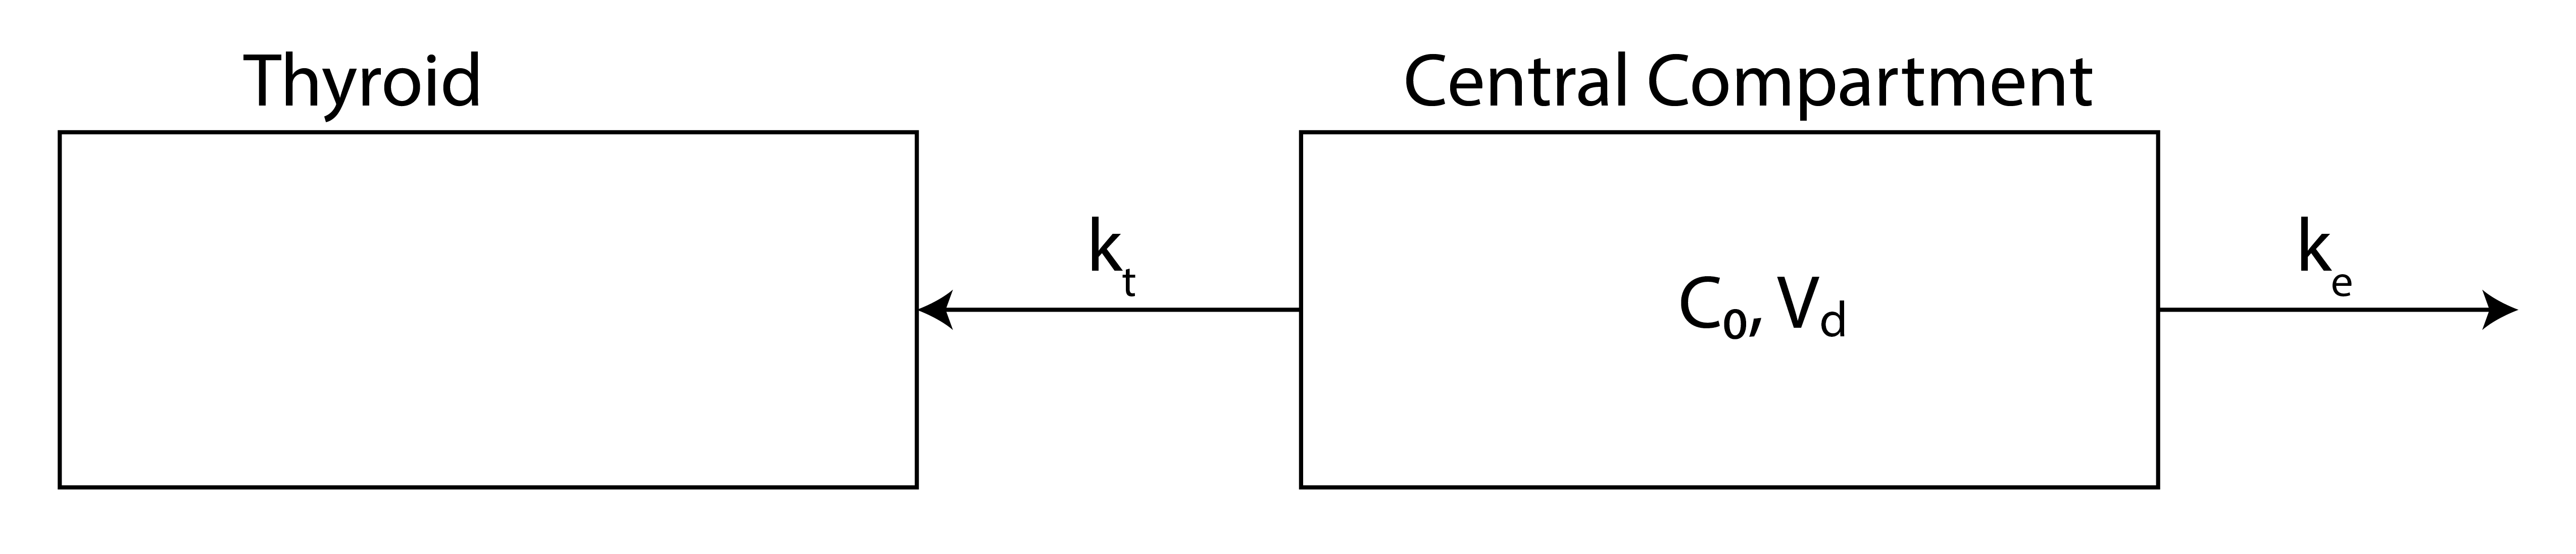
The model has two compartments (Figure 35.1). Ingested iodine passes quickly into a central compartment (the bloodstream and the well-perfused tissues it equilibrates with), from which it leaves by two competing first-order routes: excretion from the body, mostly renal (Grogan and Preuss 2023), at rate constant \(k_e\), and transport into the thyroid at rate constant \(k_t\). The thyroid is the second compartment; on the timescale of interest it accumulates iodine without releasing it. The model rests on these assumptions:
- Once ingested, iodine moves quickly through the digestive system into the central compartment, so the input is effectively instantaneous.
- Iodine release from the thyroid is slow compared with excretion and transport into the gland, so the return flux is neglected.
- The volume of distribution of the central compartment is approximately constant.
- The thyroid does not absorb so much iodine that it becomes saturated.
- Before the exposure the thyroid holds no radioactive iodine.
The central compartment
Let \(c(t)\) be the concentration of radioiodine in the central compartment and \(V_c\) its volume of distribution, the (constant) volume that converts the amount of iodine in the compartment to the measured concentration (Bisht et al. 2026). The amount of radioiodine in the compartment is then \(c\,V_c\). Iodine leaves this compartment by two first-order pathways acting in parallel: excretion from the body at rate constant \(k_e\) and transport into the thyroid at rate constant \(k_t\), each with units of inverse time. Because both removal rates are proportional to the same amount \(c\,V_c\), the mass balance for the central compartment is
\[\frac{d(c\,V_c)}{dt} = -\left(k_t + k_e\right) c\,V_c .\]
This is the single-compartment elimination equation of the one-compartment model, with the two rate constants combined into one effective removal rate \(k_t + k_e\): parallel first-order pathways add (Gibaldi and Perrier 1982). With \(V_c\) constant it divides out, leaving \(dc/dt = -(k_t+k_e)\,c\), and the concentration decays exponentially from its initial value \(c_0\),
\[c(t) = c_0\,e^{-(k_t + k_e)\,t} ,\]
with effective elimination half-life \(t_{1/2} = \ln 2/(k_t + k_e)\) (Hallare and Gerriets 2025).
The thyroid compartment
\(I(t)\) is the amount of radioiodine stored in the thyroid (for instance in millicuries), not a concentration. Iodine enters the thyroid at the transport flux \(k_t\,c\,V_c\), the same term that appears as one of the two losses in the central-compartment balance, and by assumption does not leave over the modeled window. The thyroid therefore obeys
\[\underbrace{\frac{dI}{dt}}_{\frac{\text{amount}}{\text{time}}} = \underbrace{k_t}_{\frac{1}{\text{time}}}\, \underbrace{c}_{\frac{\text{amount}}{\text{volume}}}\, \underbrace{V_c}_{\text{volume}} .\]
The units confirm the bookkeeping: a rate constant (\(1/\text{time}\)) times a concentration (\(\text{amount}/\text{volume}\)) times a volume yields an amount per unit time. The right-hand side is already known, because \(c(t)\) was found above. Substituting \(c(t) = c_0\,e^{-(k_t+k_e)t}\),
\[\frac{dI}{dt} = k_t\,V_c\,c_0\,e^{-(k_t + k_e)\,t} .\]
The right-hand side is a decaying exponential, which integrates to another exponential plus a constant,
\[I(t) = -\frac{k_t\,c_0\,V_c}{k_e + k_t}\,e^{-(k_t + k_e)\,t} + A .\]
The initial condition \(I(0) = 0\) (no radioiodine in the thyroid before the exposure) fixes the constant, \(A = k_t\,c_0\,V_c/(k_e + k_t)\). The thyroid burden is therefore
\[\boxed{\;I(t) = \frac{k_t\,c_0\,V_c}{k_e + k_t}\left(1 - e^{-(k_t + k_e)\,t}\right)\;}.\]
Since the administered dose is \(D = c_0\,V_c\), the same result reads
\[I(t) = \frac{k_t}{k_t + k_e}\,D\left(1 - e^{-(k_t + k_e)\,t}\right).\]
In this form the central volume \(V_c\) has dropped out. Predicting how much reaches the thyroid takes the amount taken in and the two rate constants, but not the volume it was spread through.
Check by substitution. \(\dfrac{dI}{dt} = \dfrac{k_t D}{k_t + k_e}\,(k_t + k_e)\,e^{-(k_t+k_e)t} = k_t D\,e^{-(k_t+k_e)t} = k_t V_c c_0\,e^{-(k_t+k_e)t}\), which matches the thyroid balance, and \(I(0) = 0\).
The start of the curve. At \(t = 0\), \(dI/dt = k_t D\). The initial rate of uptake depends on \(k_t\) but not on \(k_e\): at the first instant, all of the iodide is still in the central compartment, and elimination has not yet taken any of it away.
The rate constants come from measured iodide kinetics in euthyroid adults (adults with normal thyroid function). Each is a clearance divided by the volume it drains, the same construction as the elimination rate constant of the one-compartment model. Absorbed iodide distributes through a volume of about 38% of body weight, mostly extracellular fluid, so \(V_c \approx 25\) L for a 65-kg adult (Rousset et al. 2015). The kidneys clear iodide from 30 to 50 mL of plasma per minute (Rousset et al. 2015; Lisco et al. 2023), with 37 mL/min as a central estimate for adult men (Leggett 2010). The thyroid clears 10 to 25 mL/min on a typical iodine intake (Rousset et al. 2015); the value falls to a few mL/min on a high iodine intake and rises above 100 mL/min in iodine deficiency (Rousset et al. 2015; Lisco et al. 2023). The thyroid’s share of the total clearance is the uptake fraction. In a euthyroid adult the measured 24-hour uptake of radioiodine typically falls between about 8% and 25% of the administered activity, and it is elevated in hyperthyroidism (Pappaconstantinou et al. 2025).
The computations below take a renal clearance of 40 mL/min and a thyroidal clearance of 10 mL/min, both inside their measured ranges, which give an uptake fraction of 20% and a total clearance of 50 mL/min. Dividing each clearance by \(V_c = 25\) L converts it to a rate constant:
\[k_e = \frac{40\ \text{mL/min} \times 60\ \text{min/h}}{25\ \text{L}} = \frac{2.4\ \text{L/h}}{25\ \text{L}} = 0.096\ \text{h}^{-1}, \qquad k_t = \frac{0.6\ \text{L/h}}{25\ \text{L}} = 0.024\ \text{h}^{-1}.\]
The sum \(k_t + k_e = 0.12\ \text{h}^{-1}\) matches the measured decline of plasma iodide of about 12% per hour (Rousset et al. 2015), and the ratio \(k_t/(k_e+k_t) = 0.20\) lies inside the euthyroid uptake range. Excretion is four times faster than transport into the gland.
Modeling the thyroid burden
Consider an initial exposure of \(2.0\) mCi of Iodine-125, distributed through a central compartment of volume \(V_c = 25\) L. The initial central concentration is then \(c_0 = (2.0\ \text{mCi})/(25\ \text{L}) = 0.08\ \text{mCi/L}\), and the administered dose is \(D = c_0\,V_c = 2.0\) mCi. With \(k_t = 0.024\ \text{h}^{-1}\) and \(k_e = 0.096\ \text{h}^{-1}\), the thyroid burden \(I(t)\) follows the boxed expression. The curve below rises from zero with time constant \(\tau = 1/(k_t+k_e) = 8.3\) h and plateaus at \(I_\infty = k_t c_0 V_c/(k_e+k_t) = 0.40\) mCi. The uptake fraction is \(k_t/(k_e+k_t) = 0.20\), so the remaining \(80\%\) of the dose is excreted. In Figure 35.2, the dashed line marks the administered dose \(D\), the upper bound on the thyroid burden. The gap between the plateau and the dose line shows that most of an administered dose never reaches the gland.
# Thyroid burden I(t): the AMOUNT of iodine in the thyroid, in the same units as the dose.
# Derived in the text:  I(t) = k_t c_0 V_c / (k_e + k_t) * (1 - exp(-(k_t + k_e) t)).
# The volume of distribution V_c converts the central concentration c into an amount;
# omitting it would return a concentration, not the thyroid amount the axis reports.
def I_t(t, k_t, k_e, c_0, V_c):
    return (k_t * c_0 * V_c) / (k_e + k_t) * (1 - np.exp(-(k_t + k_e) * t))

# Parameters (euthyroid adult; see the text for the sources)
V_c = 25.0         # iodide volume of distribution, L  (about 38% of body weight)
k_e = 0.096        # excretion rate constant, 1/hr  (renal clearance 40 mL/min / V_c)
k_t = 0.024        # transport-to-thyroid rate constant, 1/hr  (thyroid clearance 10 mL/min / V_c)
c_0 = 2.0 / 25.0   # initial central concentration, mCi/L  (2.0 mCi in 25 L)
D = c_0 * V_c      # administered dose = amount initially in central compartment, mCi

t = np.linspace(0, 40, 500)             # time, hours  (about 5 time constants of 8.3 h)
I_values = I_t(t, k_t, k_e, c_0, V_c)   # thyroid burden, mCi
I_inf = k_t * c_0 * V_c / (k_e + k_t)   # plateau (asymptote), mCi

burden_color = "#3B7EA1"   # California Blue
dose_color   = "#D55E00"   # vermilion

fig, ax = plt.subplots()
ax.plot(t, I_values, color=burden_color, lw=1.8,
        label=r'$I(t)=\dfrac{k_t c_0 V_c}{k_e+k_t}\left(1-e^{-(k_t+k_e)t}\right)$')
ax.axhline(y=D, color=dose_color, linestyle='--', lw=1.3,
           label=r'administered dose $D=c_0 V_c$ = %.1f mCi' % D)
ax.axhline(y=I_inf, color='0.6', linestyle=':', lw=1.3,
           label=r'plateau $I_\infty$ = %.2f mCi' % I_inf)
ax.set_xlabel('time (hours)')
ax.set_ylabel(r'thyroid iodine $I(t)$ (mCi)')
ax.set_ylim(0, 1.15 * D)
# legend in the clear band between the plateau and the dose line
ax.legend(loc="center right")
fig.tight_layout()
plt.show()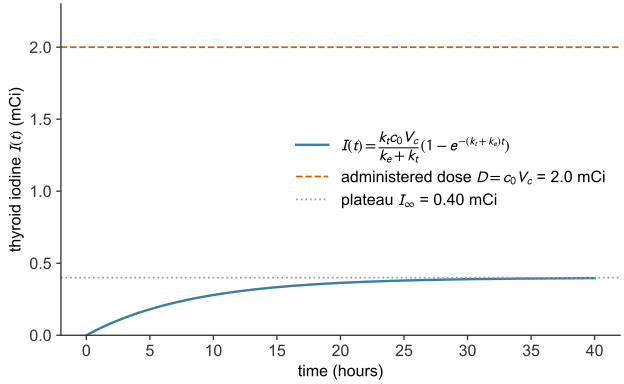
The effect of the excretion rate \(k_e\)
Increasing the excretion rate \(k_e\) diverts a larger share of the iodine out of the body before it can reach the thyroid. The plateau \(I_\infty = k_t c_0 V_c/(k_e+k_t)\) falls, because the uptake fraction \(k_t/(k_e+k_t)\) decreases. The approach to the plateau quickens, because the time constant \(1/(k_t+k_e)\) shortens. In Figure 35.3, \(k_t = 0.024\ \text{h}^{-1}\) is held fixed while \(k_e\) varies (by the slider in the web version, from \(0.024\) to \(0.4\ \text{h}^{-1}\); the printed figure shows four values over an eightfold range). The curves leave the origin with the same slope (\(k_t D\)); curves with larger \(k_e\) then level off sooner and lower. Doubling \(k_e\) from \(0.096\) to \(0.192\ \text{h}^{-1}\) lowers the plateau from \(20\%\) to \(11\%\) of the dose and shortens \(\tau\) from \(8.3\) to \(4.6\) h. A smaller \(k_e\), as when the kidneys clear iodide more slowly, sends a larger share of the dose to the gland and takes longer to deliver it.
# Vary the excretion rate k_e with the transport rate k_t fixed at its euthyroid value.
# Halving k_e (for example in renal impairment) raises the uptake fraction; doubling it lowers it.
k_t = 0.024                              # 1/hr, fixed
k_e_values = [0.048, 0.096, 0.192, 0.384]
t = np.linspace(0, 72, 500)              # hours (the slowest case has a 14 h time constant)

# Berkeley palette, ordered slowest -> fastest excretion
ke_colors = ["#3B7EA1", "#FDB515", "#009E73", "#D55E00"]

fig, ax = plt.subplots()
for k_e, col in zip(k_e_values, ke_colors):
    frac = k_t / (k_t + k_e)
    ax.plot(t, I_t(t, k_t, k_e, c_0, V_c), color=col, lw=1.8,
            label=f'$k_e = {k_e}$ /hr  (uptake {100 * frac:.0f}%)')
ax.axhline(y=D, color="0.2", linestyle='--', lw=1.3,
           label=r'administered dose $D=c_0 V_c$ = %.1f mCi' % D)
ax.set_xlabel('time (hours)')
ax.set_ylabel(r'thyroid iodine $I(t)$ (mCi)')
ax.set_ylim(0, 1.15 * D)
ax.legend(loc="center right", title=r"excretion rate $k_e$ ($k_t = 0.024$ /hr)")
fig.tight_layout()
plt.show()The effect of the transport rate \(k_t\)
Increasing the transport rate \(k_t\) has the opposite effect on the plateau but the same effect on the timing. A larger \(k_t\) raises the uptake fraction \(k_t/(k_e+k_t)\) toward one, so the plateau rises toward the full administered dose \(D\); it also shortens the time constant \(1/(k_t+k_e)\), so the plateau is reached sooner. In Figure 35.4, \(k_e = 0.096\ \text{h}^{-1}\) is held fixed while \(k_t\) varies (by the slider in the web version, from \(0.004\) to \(0.15\ \text{h}^{-1}\); the printed figure shows four values). With \(k_e\) at its euthyroid value, each \(k_t\) corresponds to a clinical uptake. \(k_t = 0.008\ \text{h}^{-1}\) gives an \(8\%\) uptake, the low end of the euthyroid range; \(0.024\ \text{h}^{-1}\) gives the \(20\%\) of the example; \(0.064\ \text{h}^{-1}\) gives a \(40\%\) uptake, in the hyperthyroid range; and \(0.144\ \text{h}^{-1}\) gives \(60\%\), typical of untreated Graves disease, in which the 24-hour uptake averages about \(65\%\) (Yang et al. 2023). At the other extreme, an underactive (hypothyroid) gland with \(k_t = 0.005\ \text{h}^{-1}\) takes up only \(5\%\) of the dose and fills with \(\tau = 9.9\) h. Raising \(k_t\) from the euthyroid value to \(0.144\ \text{h}^{-1}\) raises the plateau from \(20\%\) to \(60\%\) of the dose and shortens \(\tau\) from \(8.3\) to \(4.2\) h: one constant moves both answers, because \(k_t\) appears in the share and in the sum.
# Vary the transport rate k_t with the excretion rate k_e fixed at its euthyroid value.
# The four values span the clinical range of 24-hour uptake: 8% (low end of the euthyroid
# range), 20% (euthyroid), 40% and 60% (hyperthyroid; untreated Graves disease averages about 65%).
k_e = 0.096                              # 1/hr, fixed
k_t_values = [0.008, 0.024, 0.064, 0.144]
k_t_labels = ["low-normal", "euthyroid", "hyperthyroid", "Graves disease"]
t = np.linspace(0, 48, 500)              # hours (the slowest case has a 9.6 h time constant)

# Berkeley palette, ordered slowest -> fastest transport
kt_colors = ["#3B7EA1", "#FDB515", "#009E73", "#D55E00"]

fig, ax = plt.subplots()
for k_t, name, col in zip(k_t_values, k_t_labels, kt_colors):
    frac = k_t / (k_t + k_e)
    ax.plot(t, I_t(t, k_t, k_e, c_0, V_c), color=col, lw=1.8)
    # label each curve at its right-hand end, in the clear space past the data
    ax.text(t[-1] + 1.0, I_t(t[-1], k_t, k_e, c_0, V_c),
            f'$k_t={k_t}$ /hr: {100 * frac:.0f}%, {name}', color=col, va="center", ha="left")
ax.axhline(y=D, color="0.2", linestyle='--', lw=1.3)
ax.text(1.0, D + 0.04, r'administered dose $D=c_0 V_c$ = %.1f mCi' % D, color="0.2", va="bottom")
ax.set_xlabel('time (hours)')
ax.set_ylabel(r'thyroid iodine $I(t)$ (mCi)')
ax.set_xlim(0, 84)
ax.set_ylim(0, 1.15 * D)
fig.tight_layout()
plt.show()When to scan
The thyroid burden reaches a fraction \(1 - e^{-(k_t+k_e)t}\) of its plateau, so the time to accumulate a given fraction \(f\) is \(t = -\ln(1-f)/(k_t+k_e)\). With \(k_t + k_e = 0.12\ \text{h}^{-1}\) the gland holds \(90\%\) of its eventual burden after \(19\) hours, \(95\%\) after \(25\) hours and \(99\%\) after \(38\) hours. A scan about one day after the exposure therefore captures nearly all of the eventual thyroid burden. This agrees with clinical practice: the standard radioactive-iodine-uptake test measures the gland 24 hours after the tracer is given, sometimes with an additional early reading at 4 to 6 hours (Pappaconstantinou et al. 2025), and a detailed biokinetic model of iodine places the peak thyroid content 24 to 48 hours after intake (Leggett 2010). The 24-hour convention also standardizes the test: each laboratory’s reference range is defined at the same time point. The model’s answer and the clinical timing agree to within the spread of the measured constants: total clearance and body size move \(k_t + k_e\) over roughly \(0.10\) to \(0.15\ \text{h}^{-1}\), which moves \(t_{95}\) between about \(20\) and \(30\) hours.
The uptake fraction depends on the ratio \(k_t/(k_e+k_t)\), the time constant on the sum \(k_t + k_e\), and \(k_t\) enters both. A parameter set that overstates the fraction by making \(k_t\) too large also overstates the speed; with \(k_t\) five times \(k_e\), for instance, the model would send \(83\%\) of the dose to the gland and predict a scan within five hours. The correct fraction, \(20\%\), gives the correct timing, about a day. One day is inside the medium-time window where the model is valid: late enough that the gland has filled, early enough that neither the slow release of iodine from the thyroid nor the physical decay of Iodine-125 (half-life about 59 days) is appreciable.
The earliest detectable scan
A scanner detects the thyroid’s radioactivity only once the thyroid holds at least \(I_{\text{image}}\). The waiting time \(t_{\text{wait}}\) is when the curve crosses that level. Setting \(I(t_{\text{wait}}) = I_{\text{image}}\) and writing the plateau as \(I_\infty\),
\[I_{\text{image}} = I_\infty\left[1 - e^{-(k_t+k_e)\,t_{\text{wait}}}\right] \;\Longrightarrow\; e^{-(k_t+k_e)\,t_{\text{wait}}} = 1 - \frac{I_{\text{image}}}{I_\infty} = \frac{I_\infty - I_{\text{image}}}{I_\infty}.\]
import numpy as np

# Earliest detectable thyroid scan (given problem values; deterministic)
D, kt, ke = 2.0, 0.024, 0.096     # mCi, 1/h, 1/h
I_image   = 0.30                  # scanner threshold, mCi

s     = kt + ke
tau   = 1 / s
I_inf = kt / s * D
t95   = tau * np.log(20)
I_24  = I_inf * (1 - np.exp(-s * 24))
t_wait = tau * np.log(I_inf / (I_inf - I_image))     # needs I_image < I_inf

print(f"tau = {tau:.2f} h, I_inf = {I_inf:.2f} mCi, t95 = {t95:.1f} h")
print(f"I(24 h) = {I_24:.2f} mCi ({I_24 / I_inf:.0%} of the plateau)")
print(f"t_wait = {t_wait:.1f} h for I_image = {I_image} mCi")
tau = 8.33 h, I_inf = 0.40 mCi, t95 = 25.0 h
I(24 h) = 0.38 mCi (94% of the plateau)
t_wait = 11.6 h for I_image = 0.3 mCi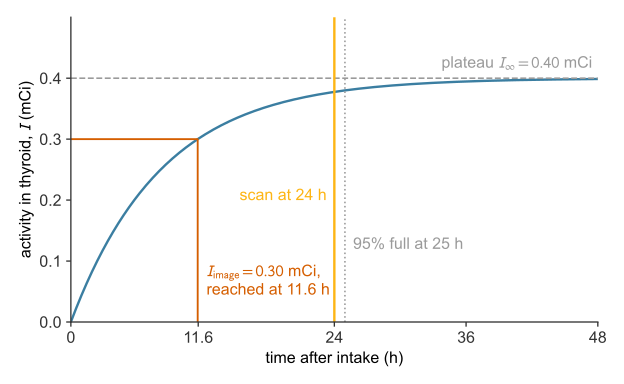
Exercises
These problems apply the two-compartment iodine model: the central-compartment decay \(c(t)=c_0 e^{-(k_t+k_e)t}\), the thyroid burden \(I(t)=\frac{k_t c_0 V_c}{k_e+k_t}\left(1-e^{-(k_t+k_e)t}\right)\), its plateau \(I_\infty\), and the uptake fraction \(k_t/(k_e+k_t)\). Unless stated otherwise, take an administered dose \(D=c_0 V_c = 2.0\) mCi (\(c_0 = 0.08\) mCi/L, \(V_c = 25\) L) and the euthyroid rate constants \(k_t = 0.024\ \text{h}^{-1}\) and \(k_e = 0.096\ \text{h}^{-1}\). Work each before revealing its answer.
References
Bisht, Supriya, Vikas Chauhan, and Preeti Patel. 2026. “Clinical Significance of Volume of Distribution in Pharmacotherapy.” In StatPearls. StatPearls Publishing. https://www.ncbi.nlm.nih.gov/books/NBK545280/.
Choudhury, Parthajit Sengupta, and Manisha Gupta. 2018. “Differentiated Thyroid Cancer Theranostics: Radioiodine and Beyond.” The British Journal of Radiology 91: 20180136. https://doi.org/10.1259/bjr.20180136.
Gibaldi, Milo, and Donald Perrier. 1982. Pharmacokinetics. 2nd ed. Marcel Dekker.
Grogan, Sean, and Charles V. Preuss. 2023. “Pharmacokinetics.” In StatPearls. StatPearls Publishing. https://www.ncbi.nlm.nih.gov/books/NBK557744/.
Hallare, Jericho, and Valerie Gerriets. 2025. “Elimination Half-Life of Drugs.” In StatPearls. StatPearls Publishing. https://www.ncbi.nlm.nih.gov/books/NBK554498/.
Leggett, Richard W. 2010. “A Physiological Systems Model for Iodine for Use in Radiation Protection.” Radiation Research 174 (4): 496–516. https://doi.org/10.1667/RR2243.1.
Lisco, Giuseppe, Anna De Tullio, Domenico Triggiani, et al. 2023. “Iodine Deficiency and Iodine Prophylaxis: An Overview and Update.” Nutrients 15 (4): 1004. https://doi.org/10.3390/nu15041004.
Pappaconstantinou, Henry, Tyler F. Heston, and Michelle N. Tran. 2025. “I-123 Uptake.” In StatPearls. StatPearls Publishing. https://www.ncbi.nlm.nih.gov/books/NBK559314/.
Rousset, Bernard, Corinne Dupuy, Françoise Miot, and Jacques Dumont. 2015. “Thyroid Hormone Synthesis and Secretion.” In Endotext, edited by Kenneth R. Feingold, Bradley Anawalt, Marc R. Blackman, et al. MDText.com, Inc. https://www.ncbi.nlm.nih.gov/books/NBK285550/.
Yang, Qian, Wencai Ke, Fanfan Pan, Xinmei Huang, Jun Liu, and Bingbing Zha. 2023. “Association Between Radioactive Iodine Uptake and Neutropenia in Untreated Graves’ Disease.” Endocrine Connections 12 (2): e220474. https://doi.org/10.1530/EC-22-0474.